

The AIER Business Conditions Monthly indicators reflected a noticeable downshift in US economic momentum in March 2025.
The Leading Indicator fell from 54 in February to 42 in March — a steep 12-point drop — marking the largest monthly decline in that series since April 2020 at the height of the pandemic shock. The Roughly Coincident Indicator slipped 17 points to a neutral 50, also the sharpest one-month decline since early 2020, erasing much of the modest strength seen in recent months. The Lagging Indicator dropped 33 points to a contractionary 42 — not only its largest monthly decline since May 2020 but also its first significant retreat since late 2023.
Leading Indicator (42)
In March, the Leading Index fell to 42, with five of twelve components rising and seven declining, marking a broad-based weakening in forward-looking measures.
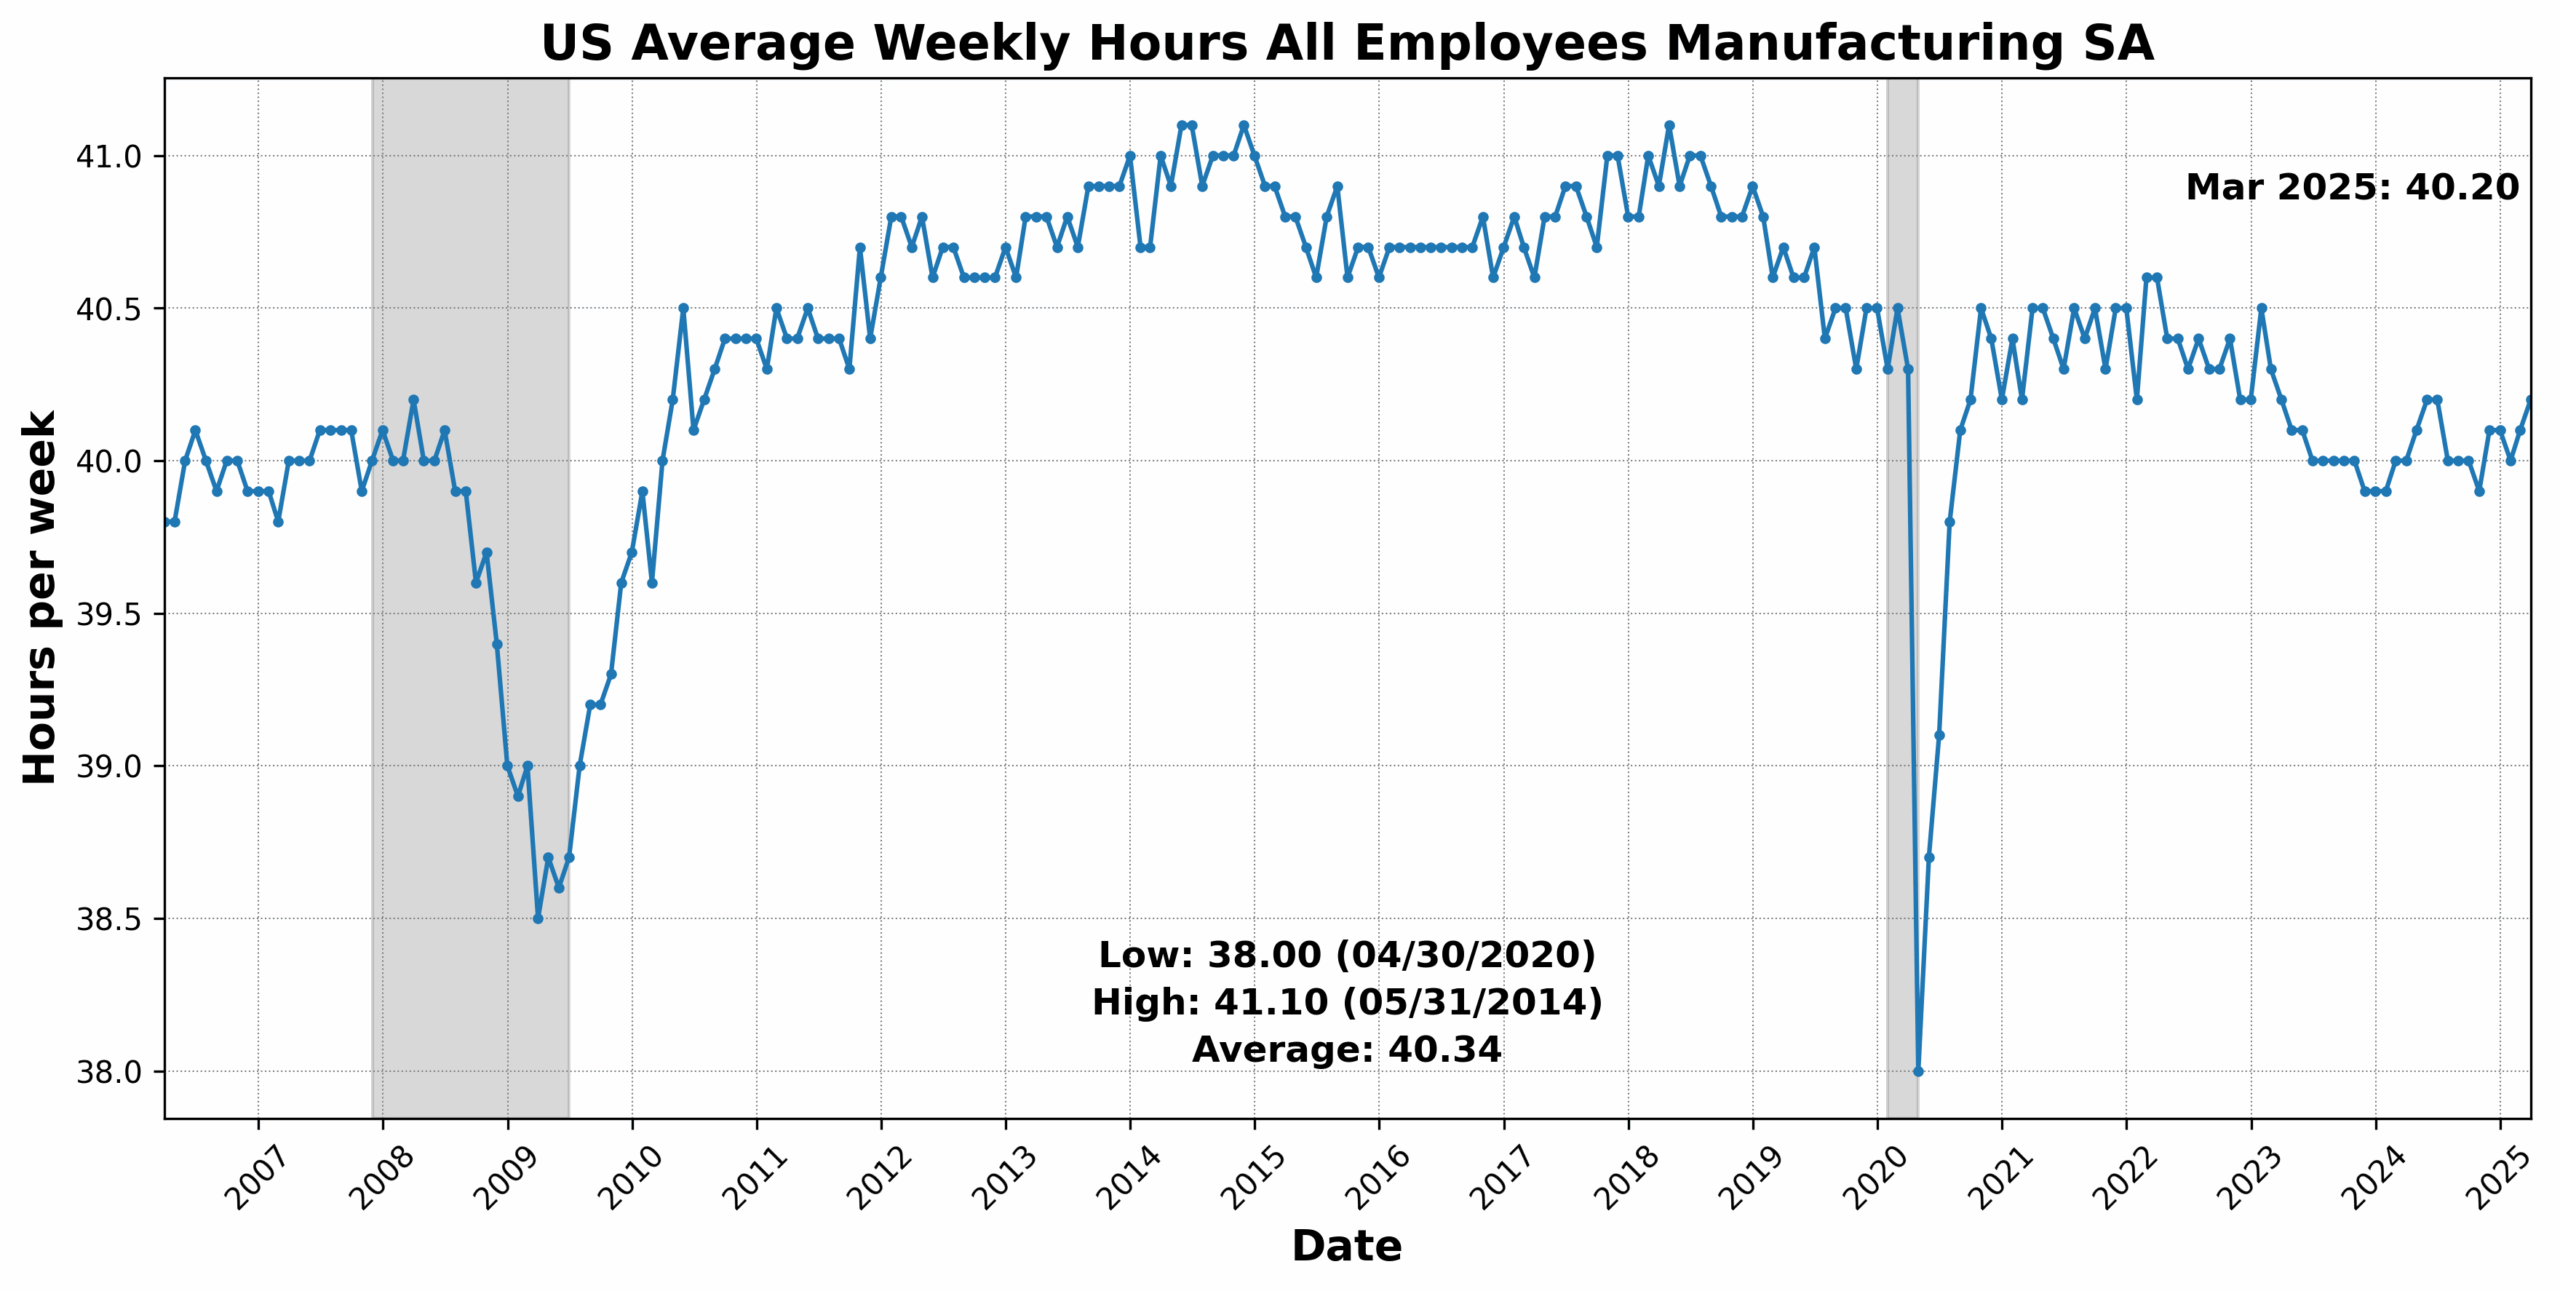
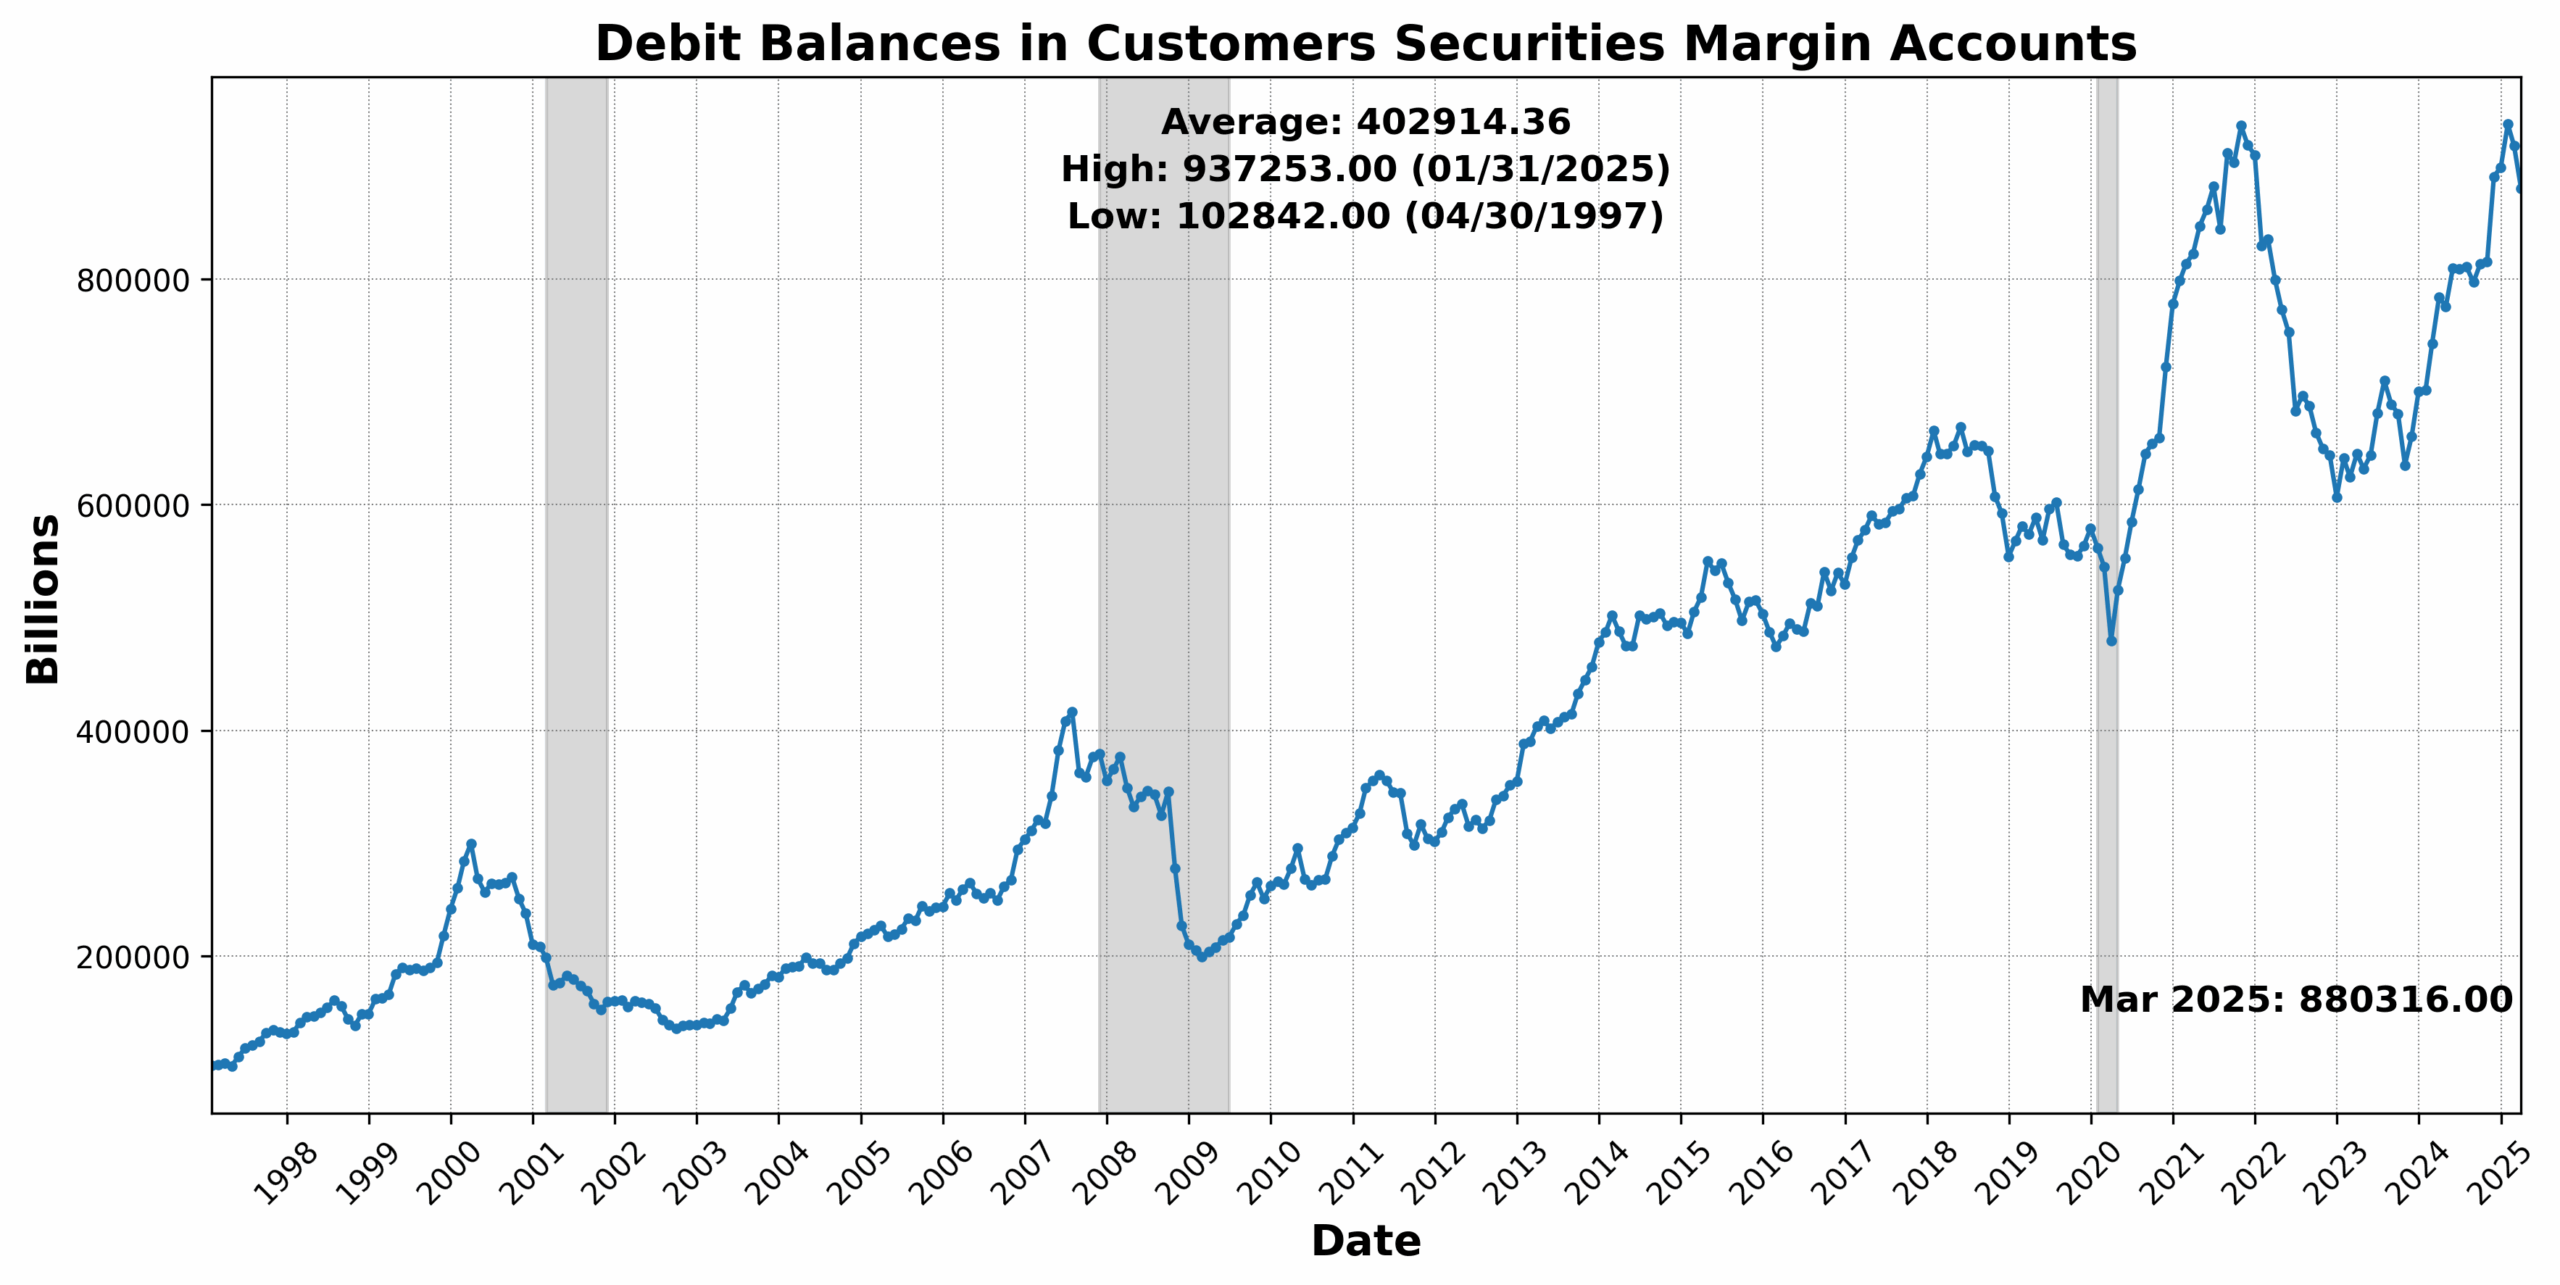
The biggest gain came from United States Heavy Trucks Sales SAAR, which jumped 42.3 percent, possibly due to fleet replacement activity or protectionist/regulatory anticipation. FINRA Customer Debit Balances in Margin Accounts rose 3.2 percent, suggesting increased investor risk appetite. Adjusted Retail & Food Services Sales Total SA climbed 1.5 percent, and US Average Weekly Hours All Employees Manufacturing SA rose 0.2 percent, pointing to some stability in labor demand. Conference Board US Leading Index Manuf New Orders Consumer Goods & Materials ticked up 0.1 percent, a modest positive for early-stage manufacturing.
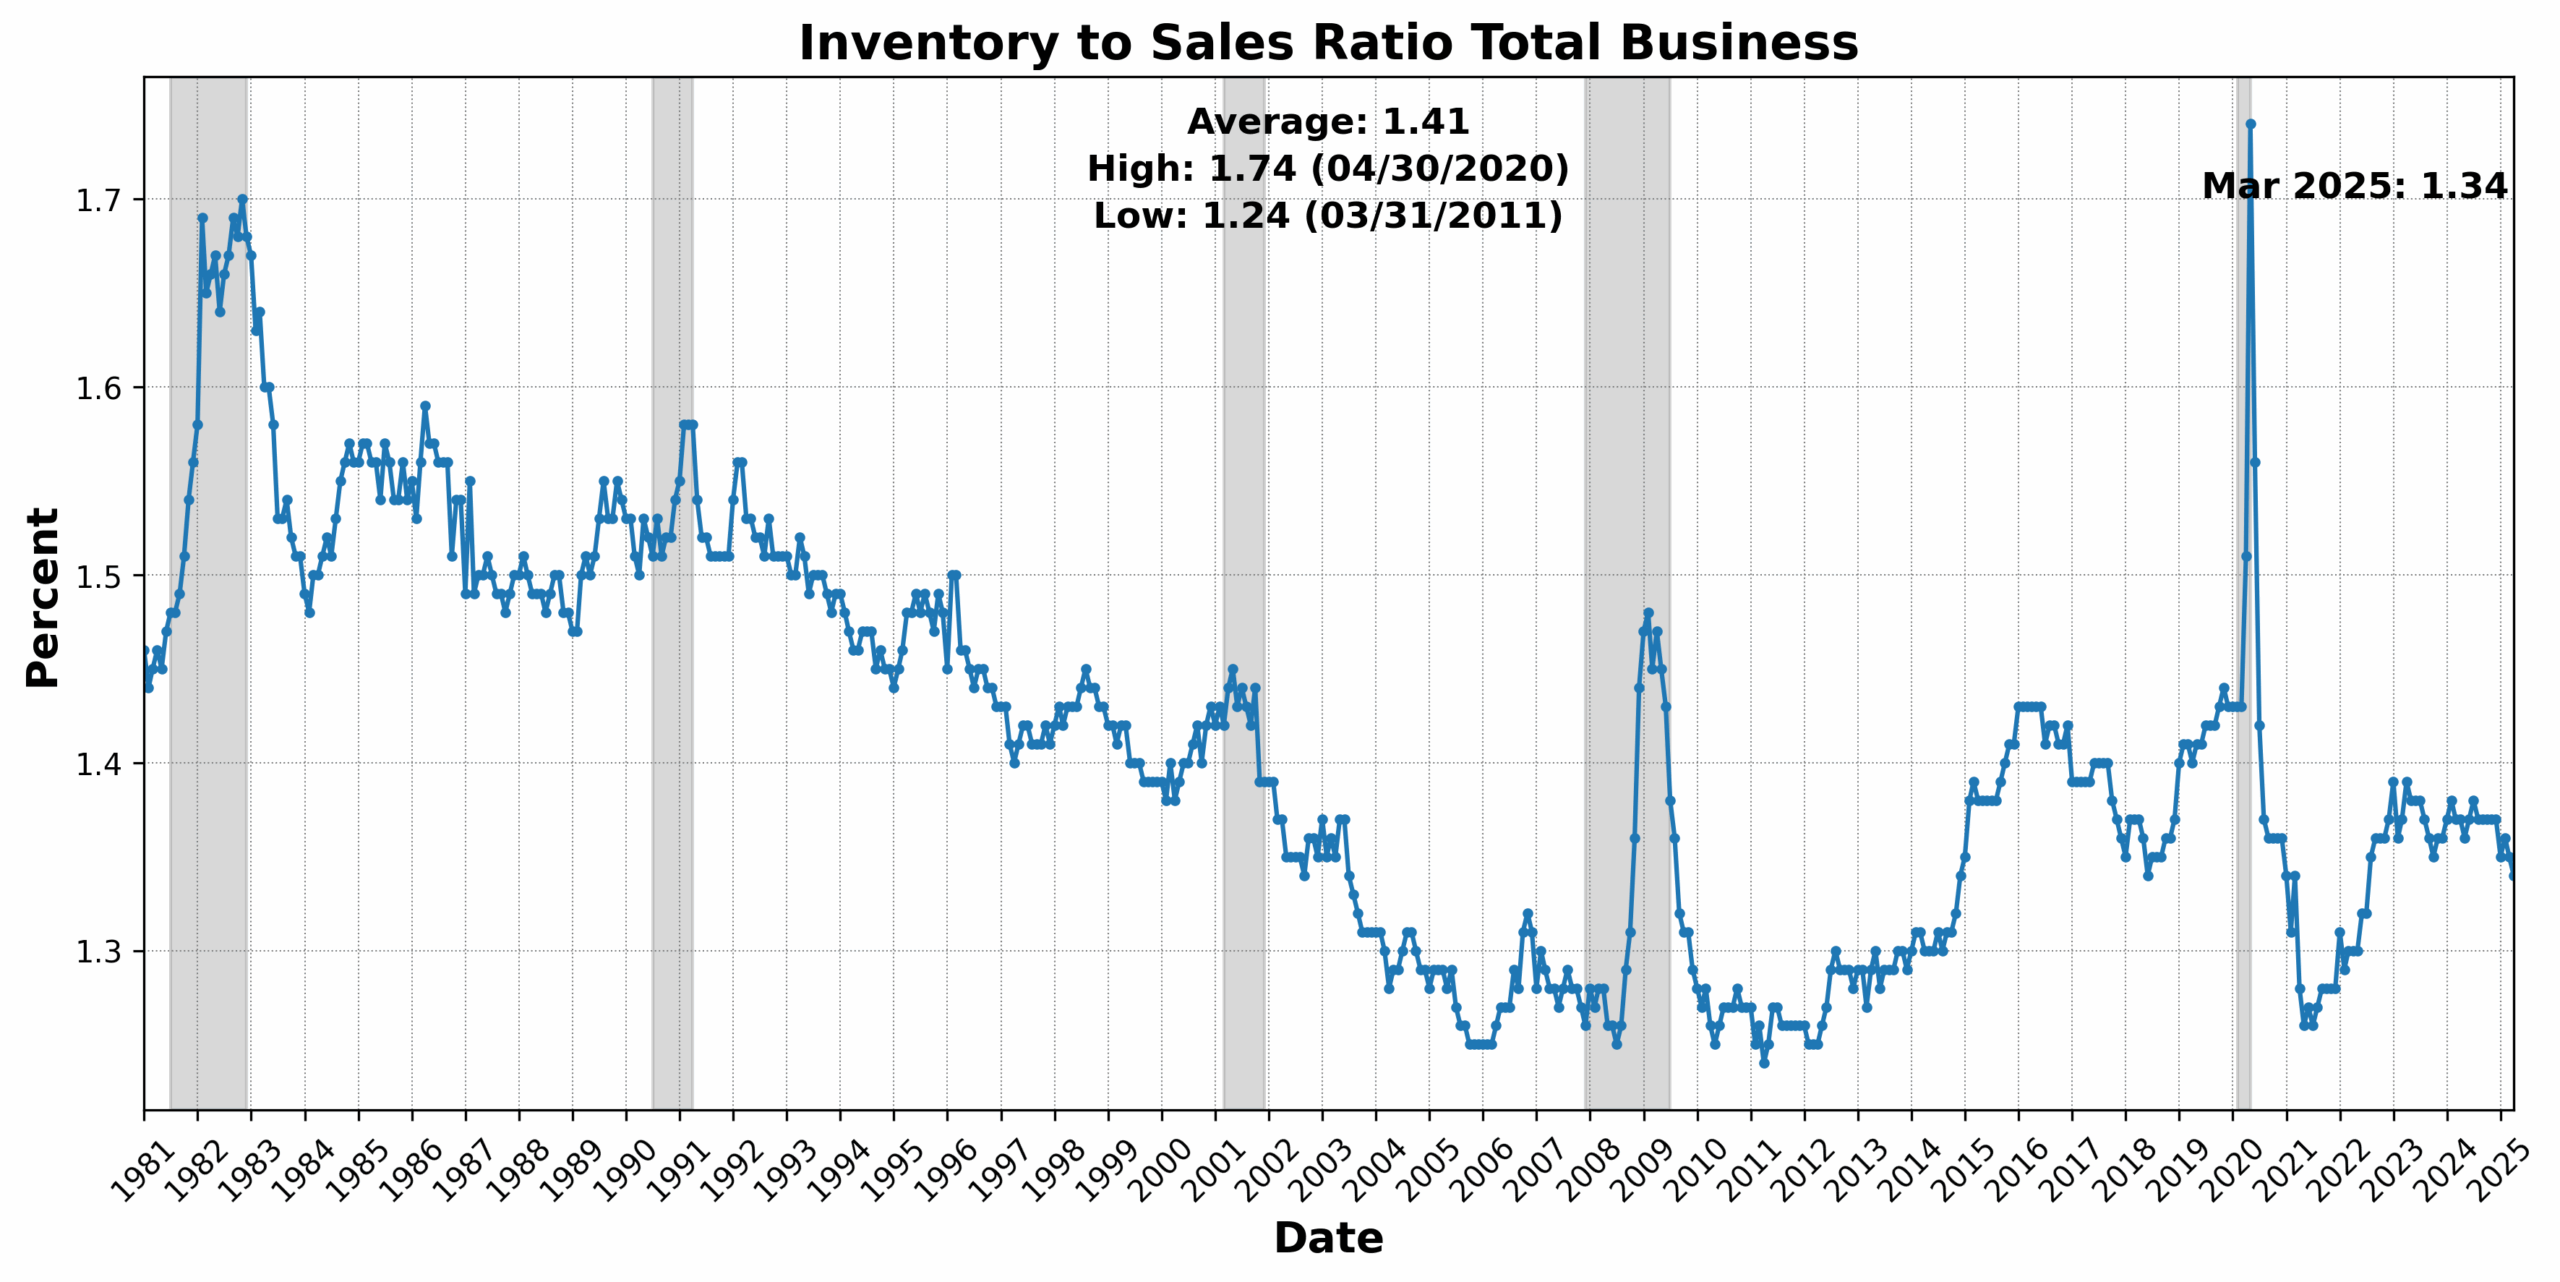
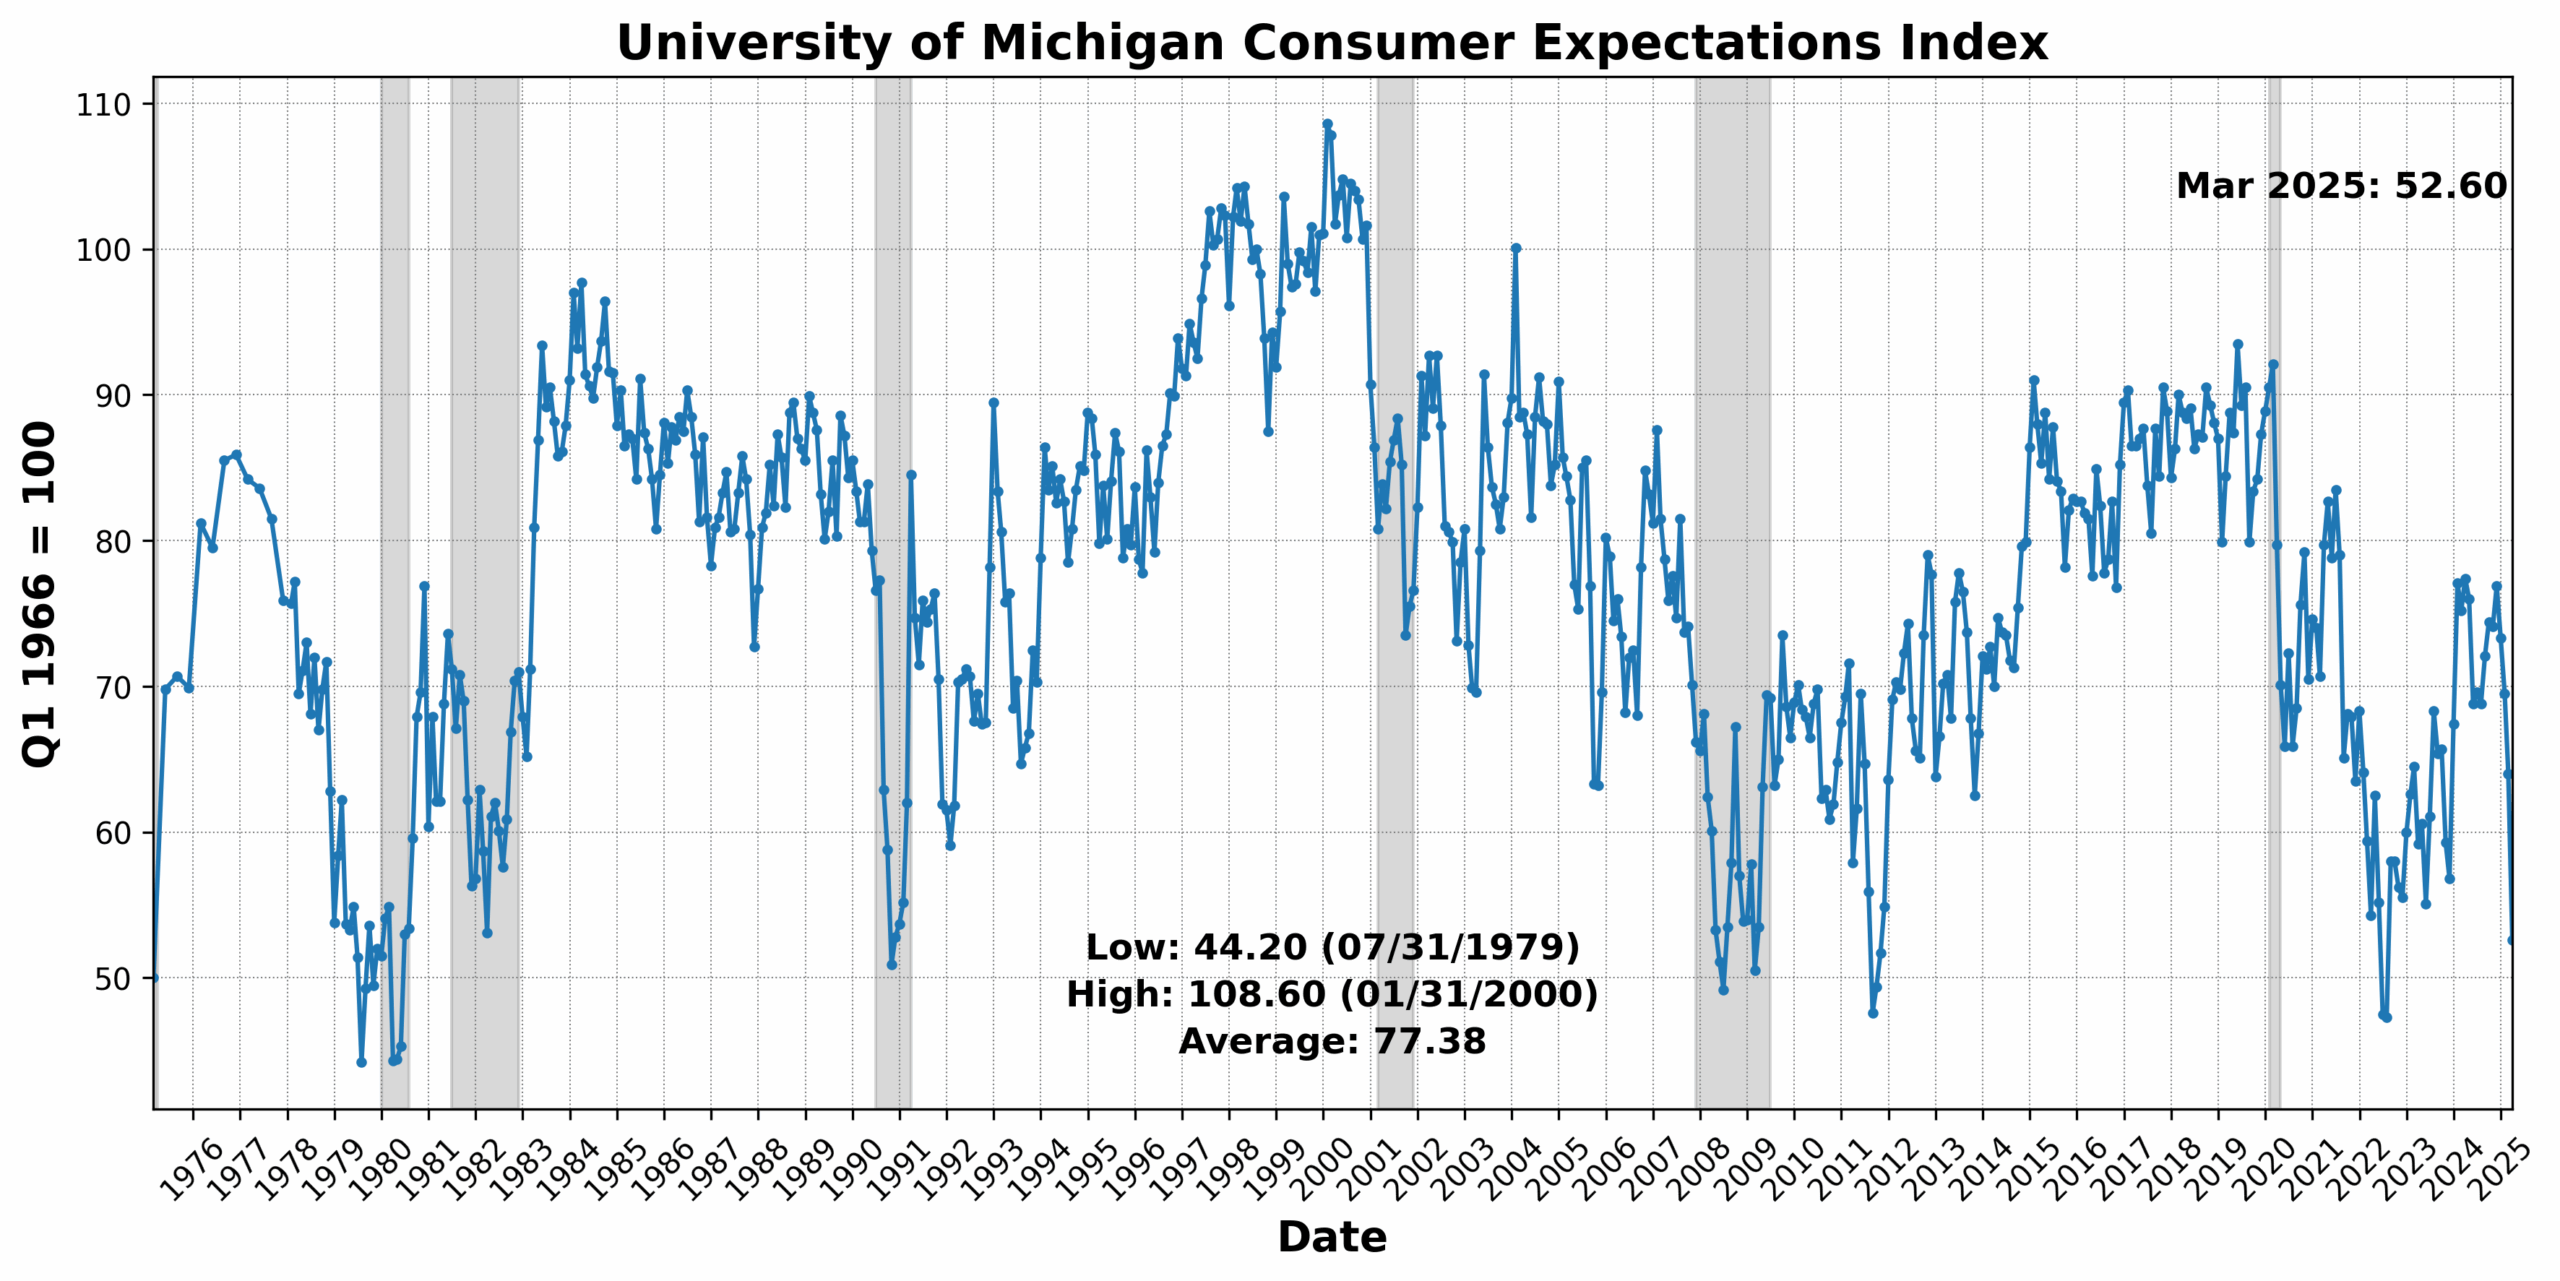
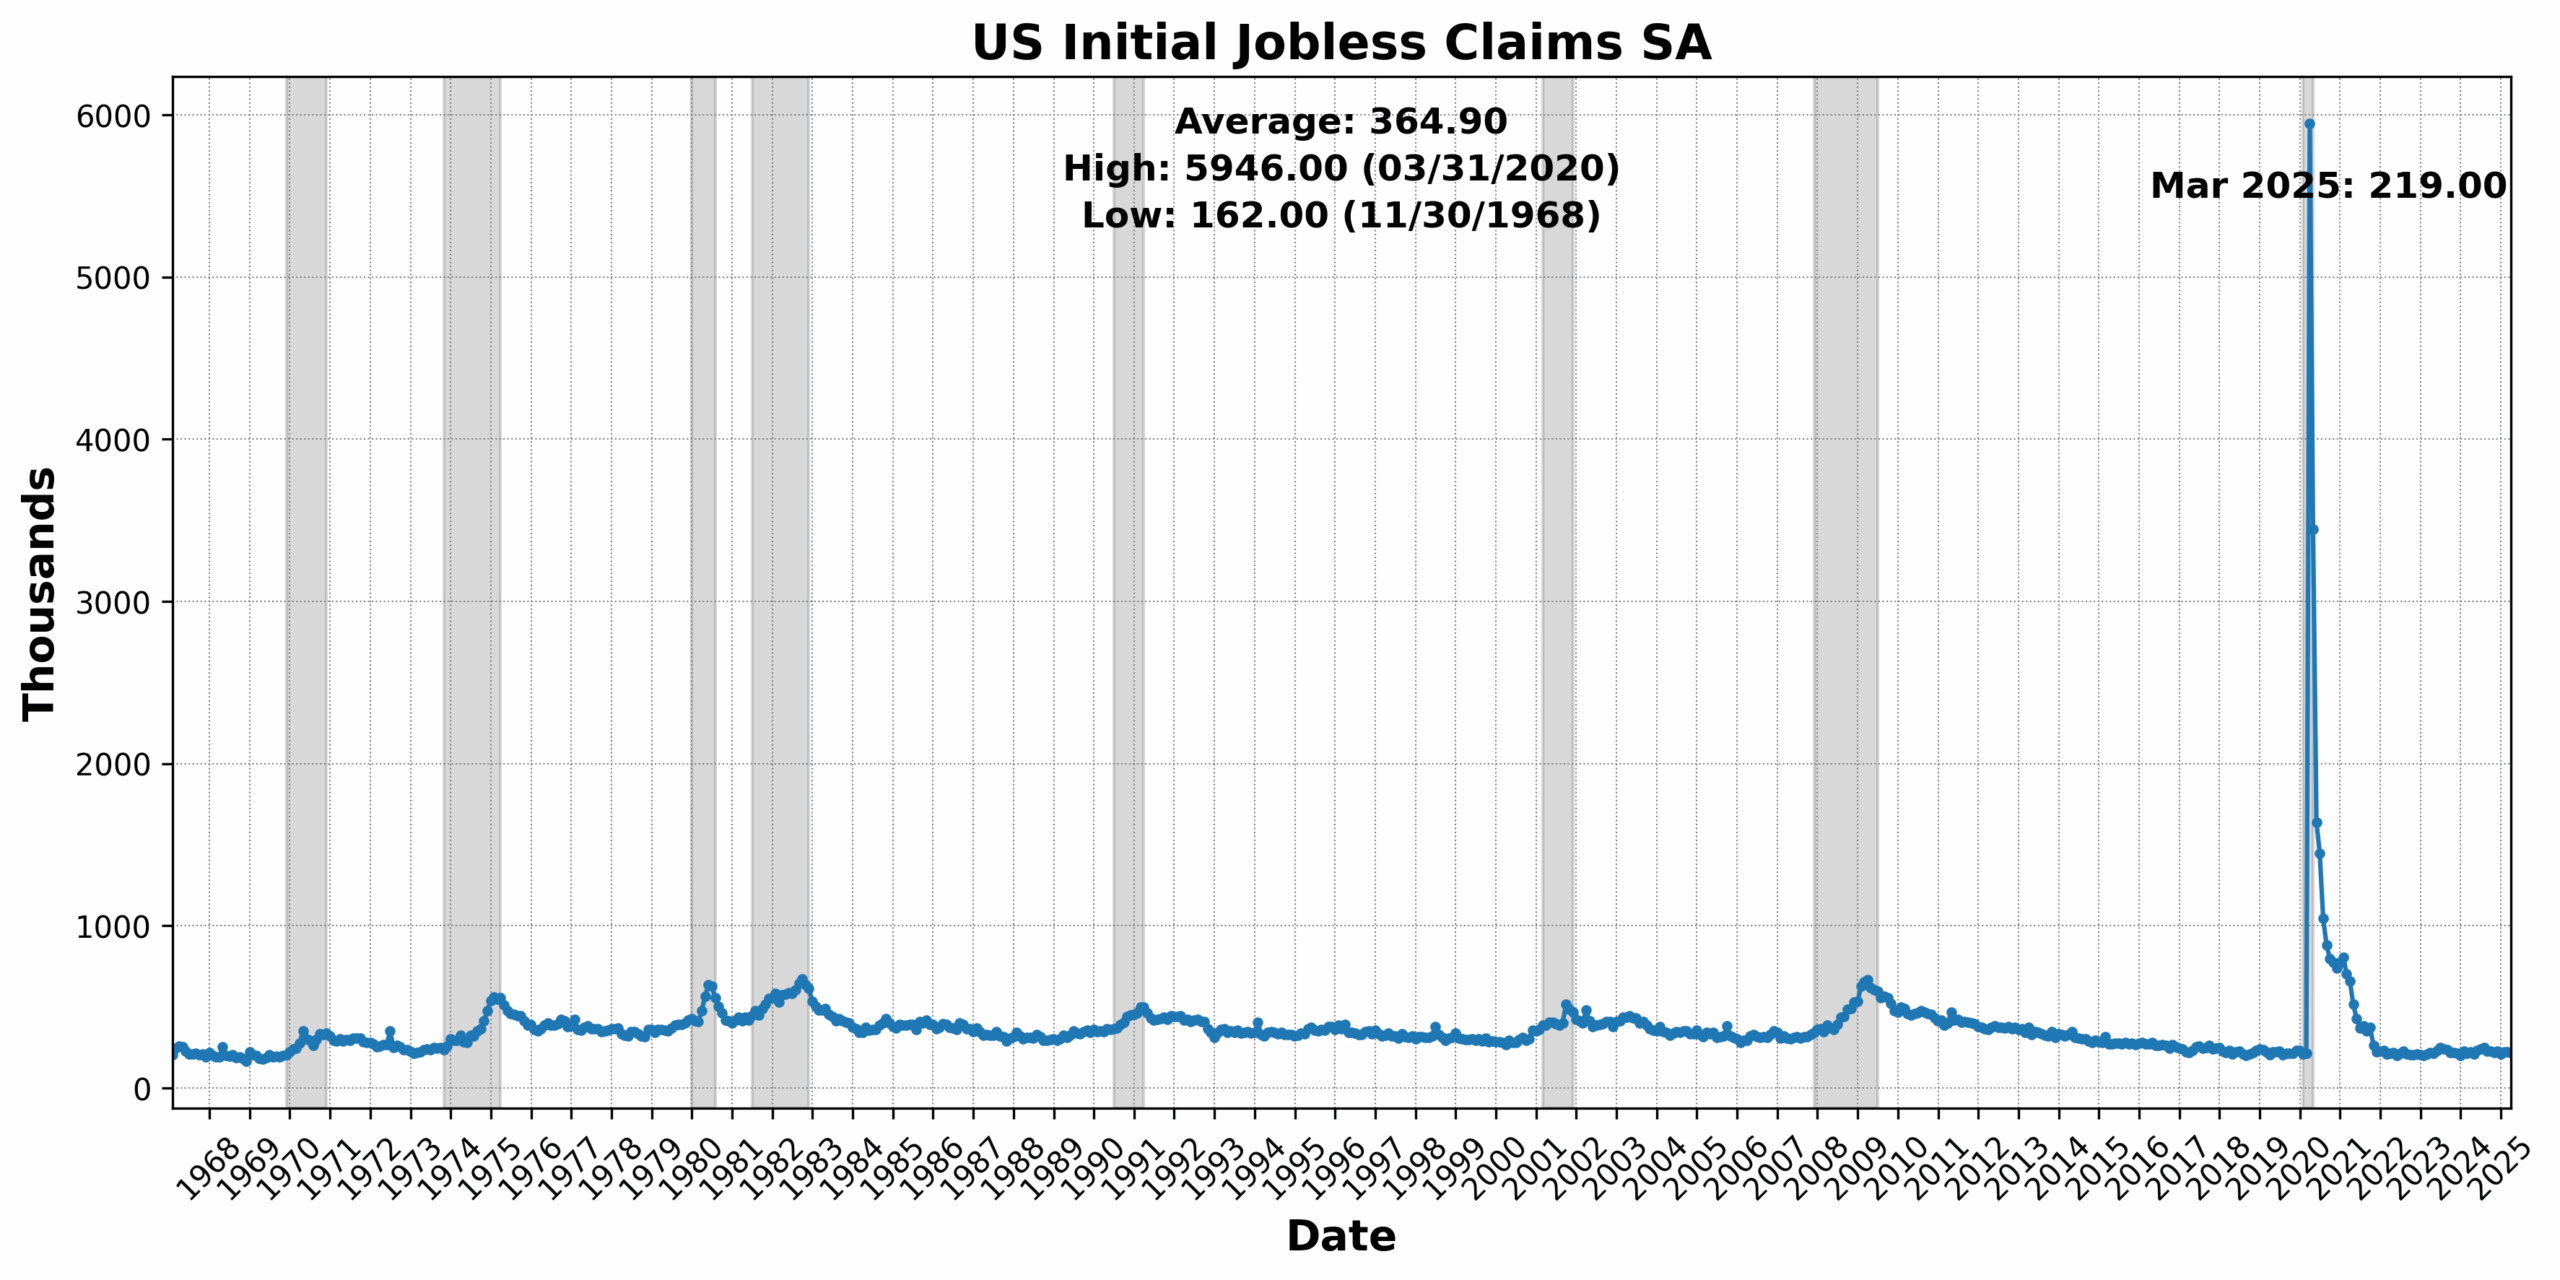
Offsetting those gains were steep declines in University of Michigan Consumer Expectations Index, down 17.8 percent, and US New Privately Owned Housing Units Started by Structure Total SAAR, which fell 11.4 percent. The Conference Board US Leading Index Stock Prices 500 Common Stocks dropped 5.9 percent, mirroring volatility in equity markets, and the 1-to-10 year US Treasury spread remained sharply inverted at -4.1 percent. US Initial Jobless Claims SA fell 2.2 percent, while Inventory/Sales Ratio: Total Business slipped 0.7 percent, and Conference Board US Manufacturers New Orders Nondefense Capital Good Ex Aircraft declined 0.2 percent.
Roughly Coincident Indicator (50)
The Roughly Coincident Index came in at 50 in March, with three of six components rising and three declining, continuing the theme of mixed underlying performance.
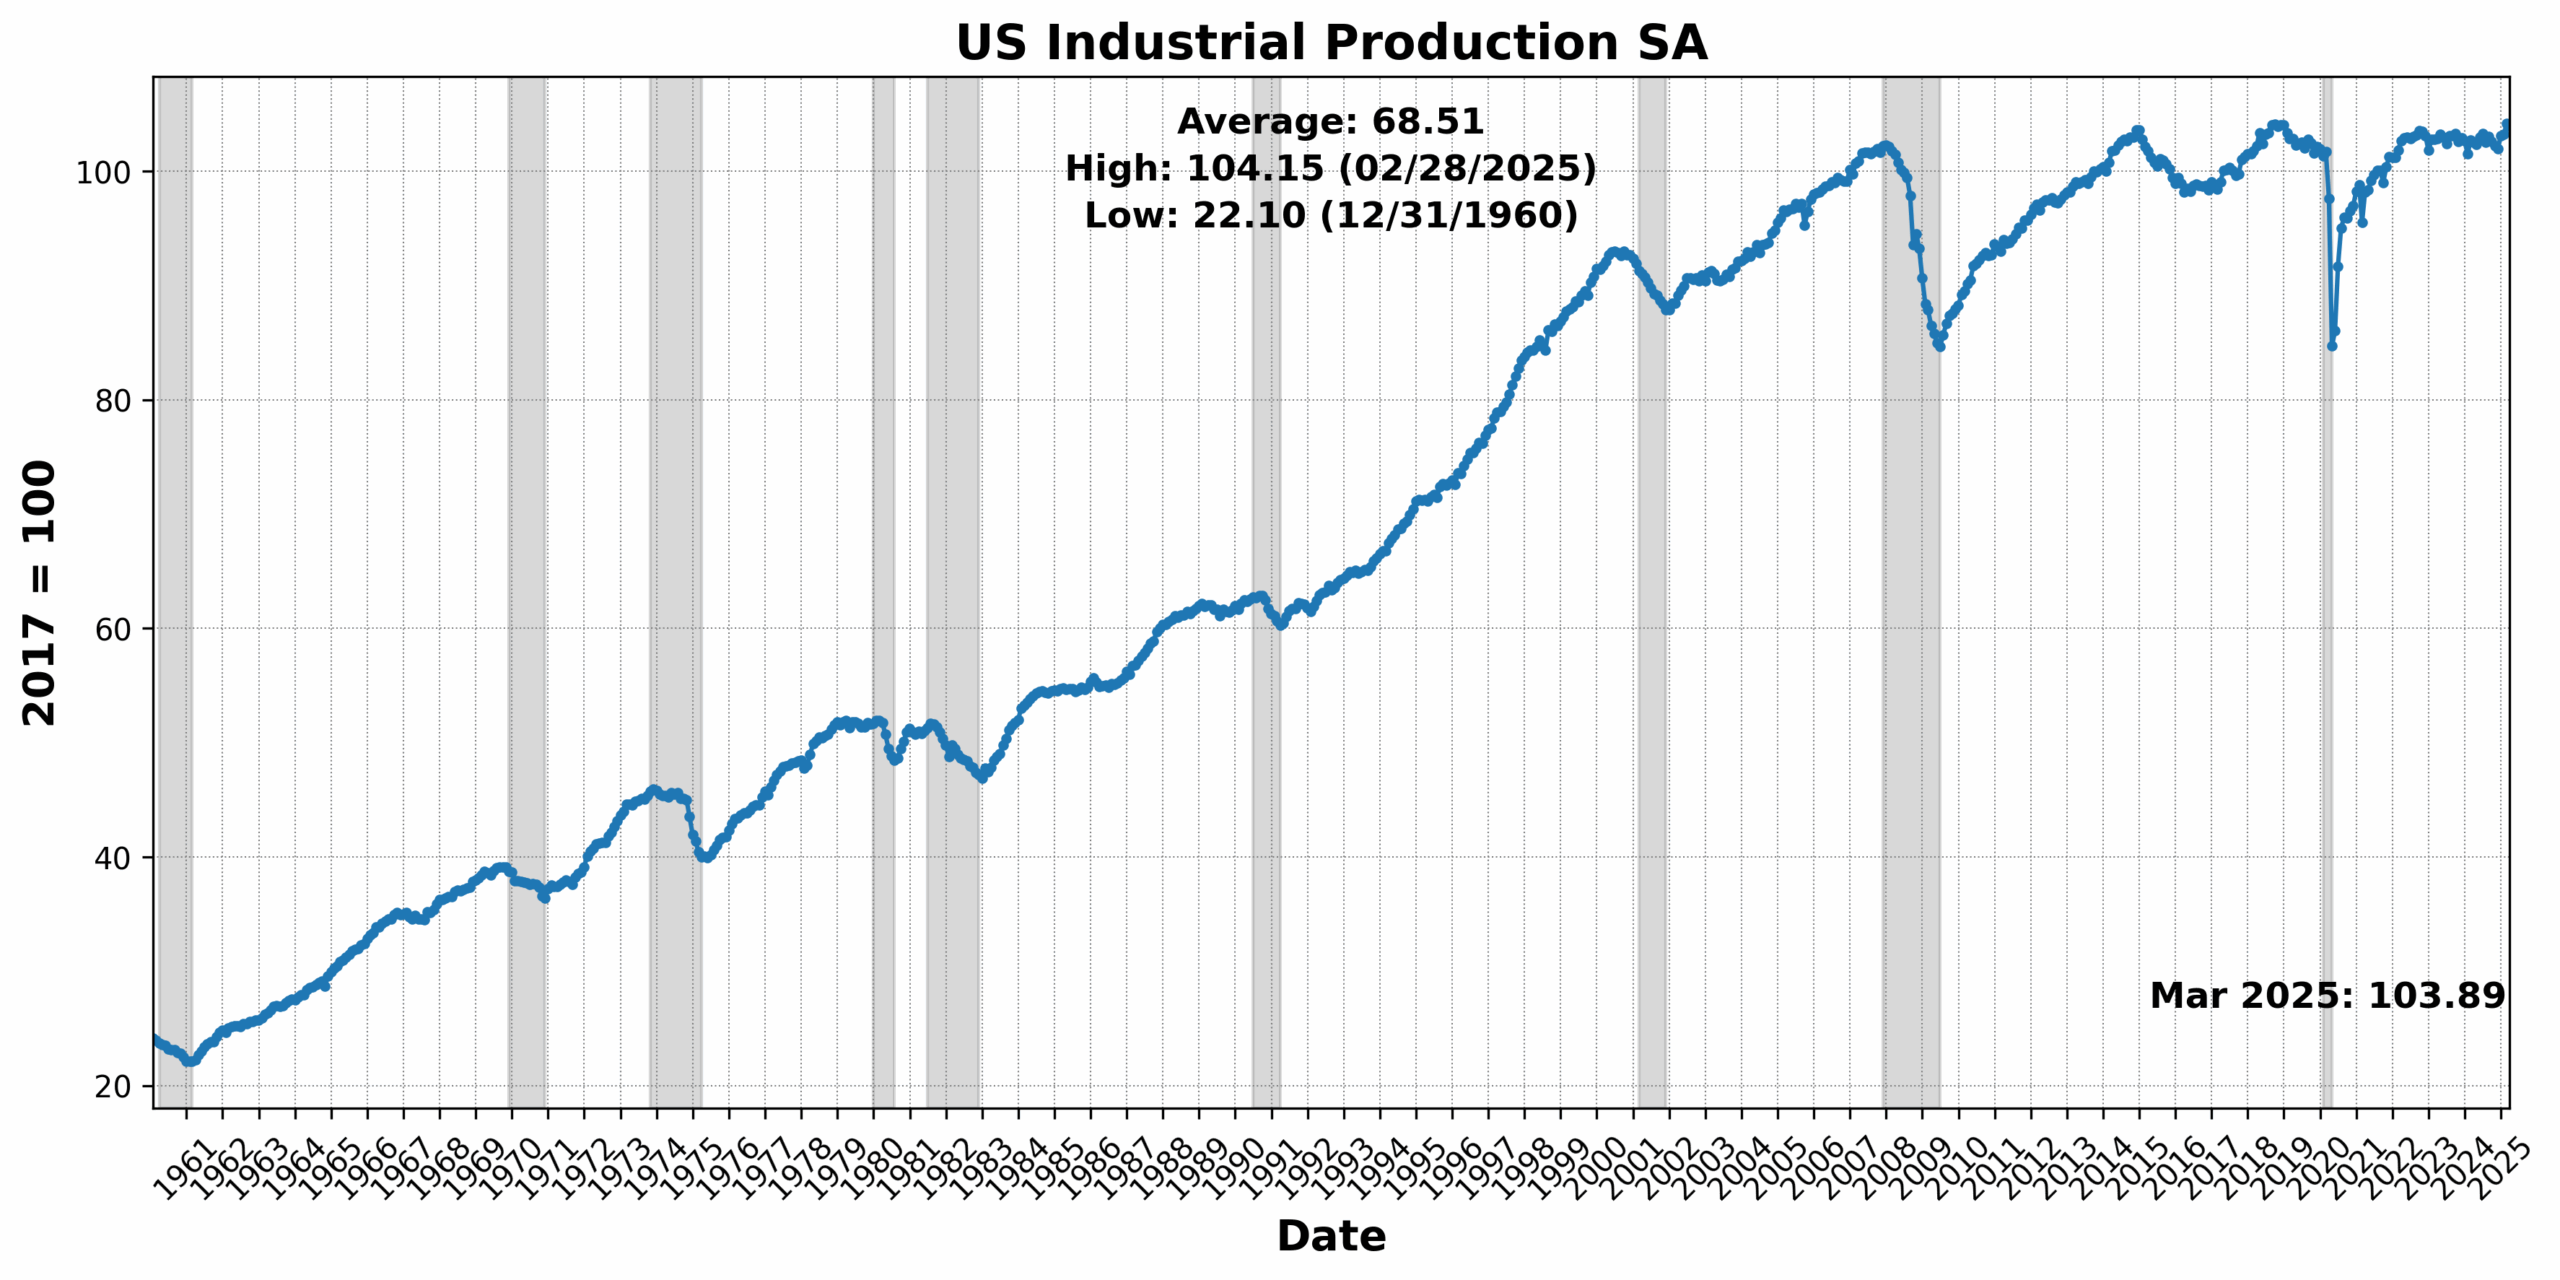
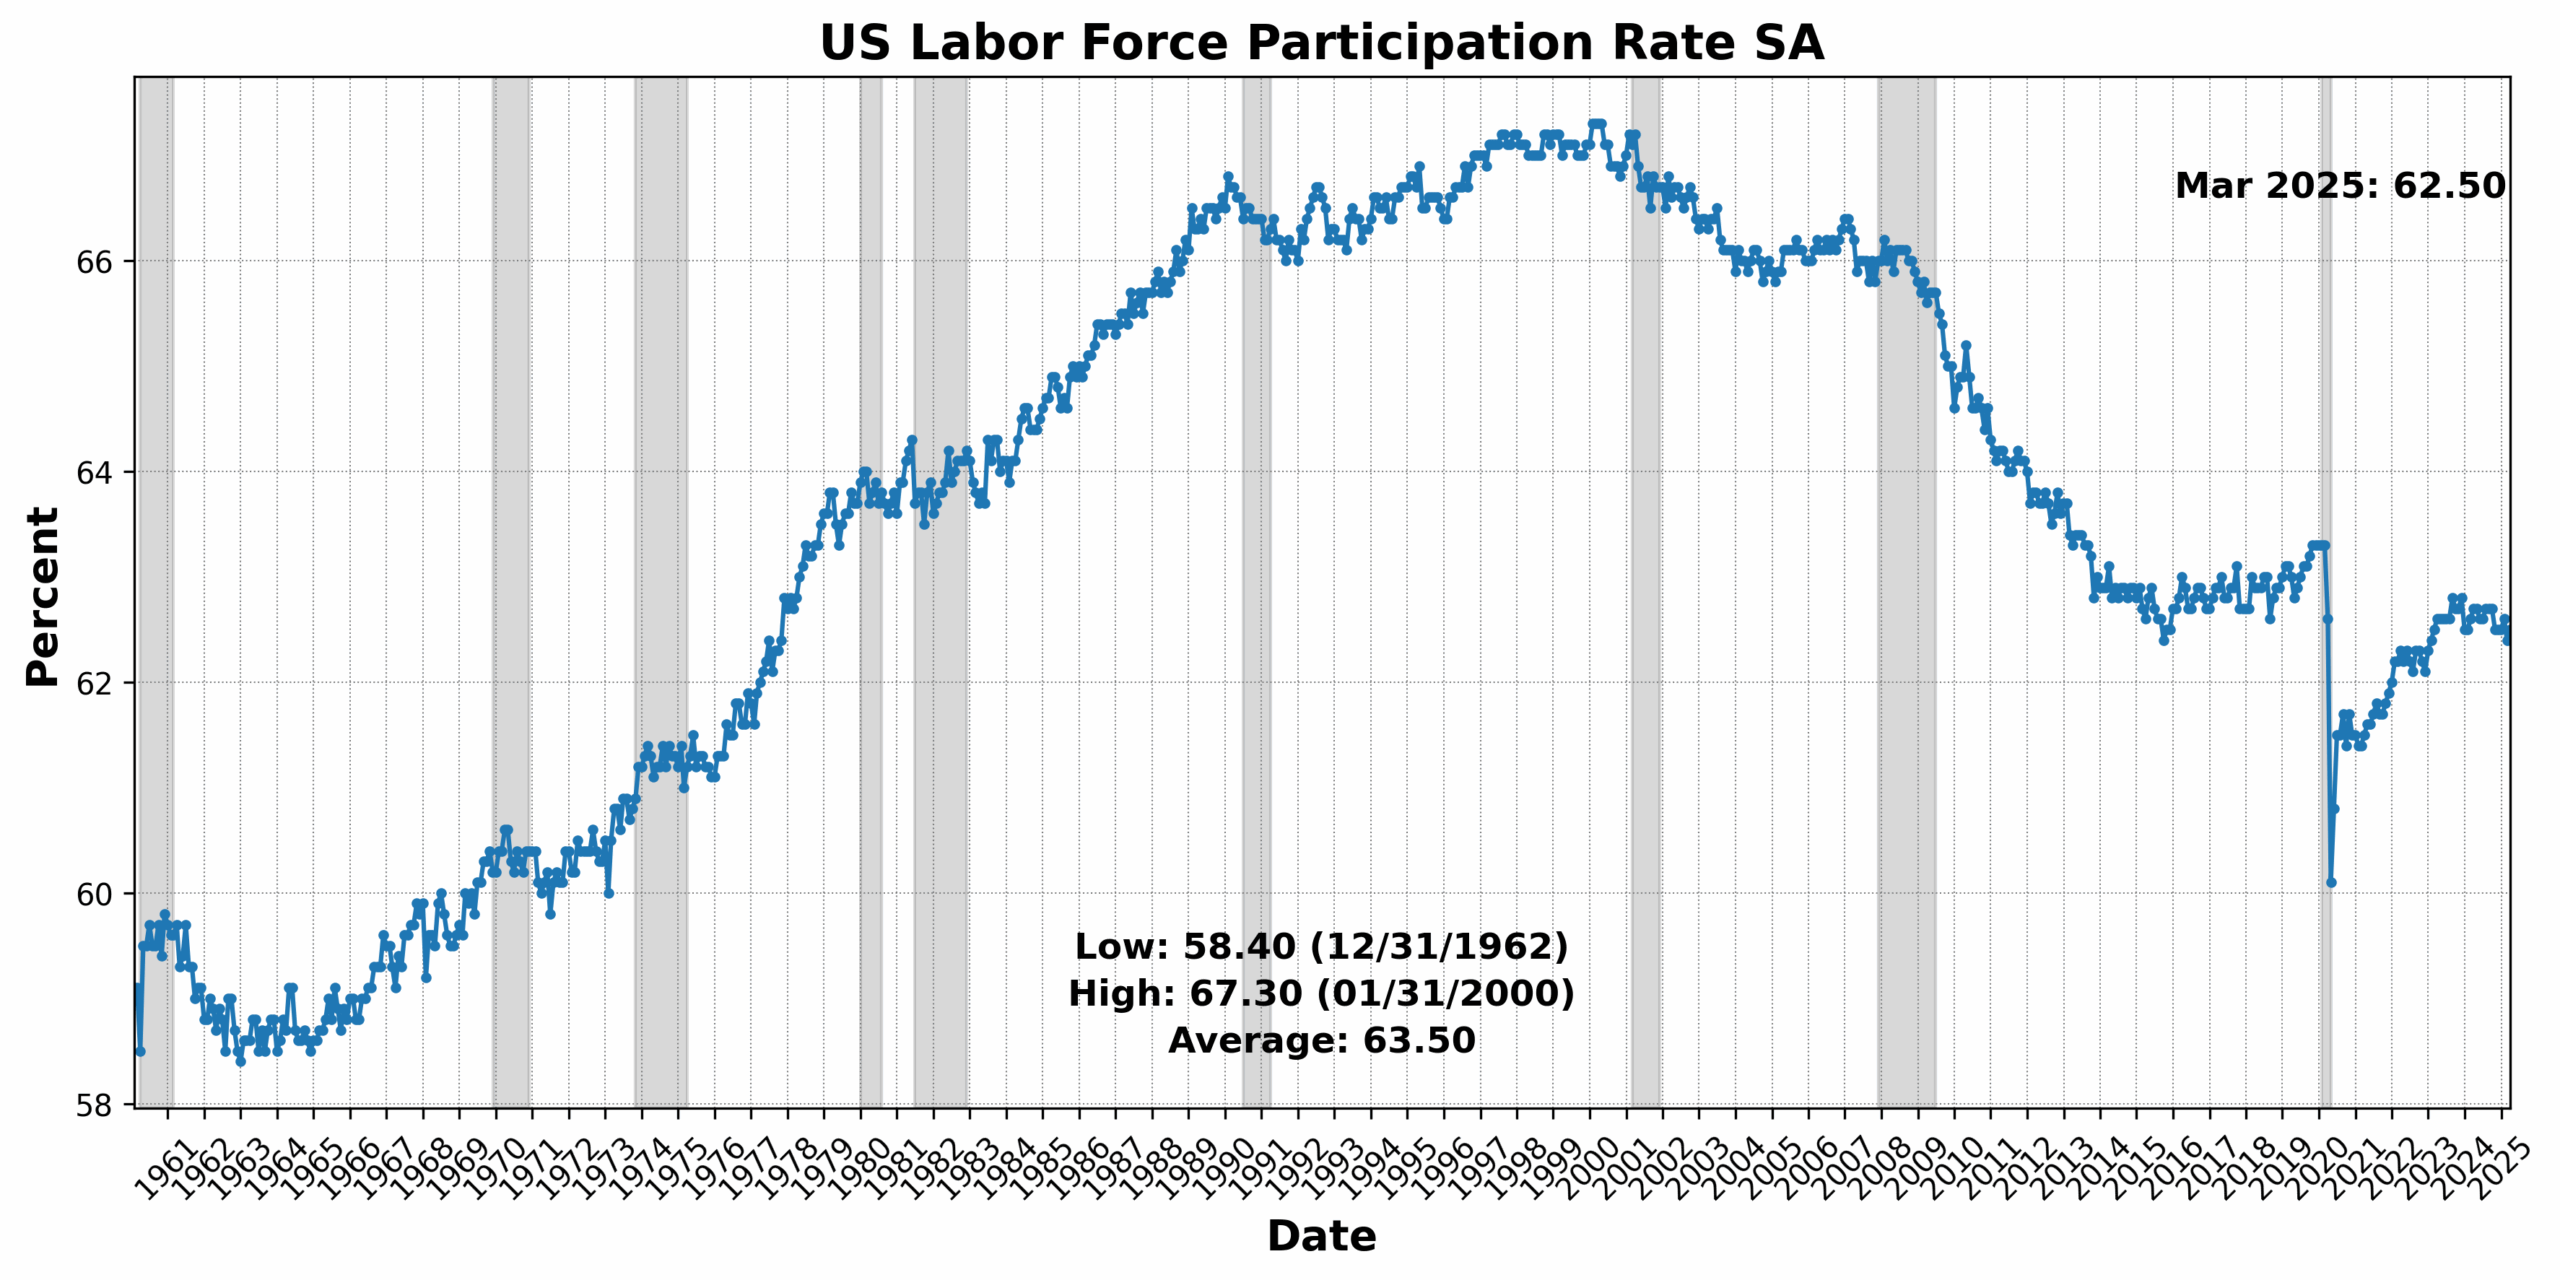
Conference Board Coincident Personal Income Less Transfer Payments increased 0.7 percent, while US Labor Force Participation Rate SA and US Employees on Nonfarm Payrolls Total SA rose 0.2 percent and 0.1 percent, respectively — small but positive signals from the labor market. On the downside, US Industrial Production SA fell 0.3 percent, Conference Board Coincident Manufacturing and Trade Sales declined 0.6 percent, and Conference Board Consumer Confidence Present Situation SA 1985=100 dropped 2.7 percent, indicating rising consumer concerns.
Lagging Indicator (42)
The Lagging Index held at dropped to 42, with three components rising, one flat, and two declining.
Conference Board US Lagging Avg Duration of Unemployment jumped 7.0 percent, a notable signal of worsening conditions for job seekers. Conference Board US Lagging Commercial and Industrial Loans rose 0.3 percent, and US Manufacturing & Trade Inventories Total SA increased 0.1 percent, indicating marginal growth in business credit and stockpiles. US Commercial Paper Placed Top 30 Day Yield was unchanged.
On the downside, Census Bureau US Private Constructions Spending Nonresidential NSA fell 0.8 percent, while US CPI Urban Consumers Less Food & Energy YoY NSA dropped 9.7 percent, marking a sharp disinflation in core prices and raising fresh questions about demand-side weakness.
Taken together, the March 2025 Business Conditions Monthly numbers show a broad-based deterioration in US economic momentum, particularly in forward-looking and long-cycle measures. With the highest policy uncertainty on record (back to the start of the Baker, Bloom, and Davis measures in 1986), weakening consumer and business sentiment, and signs of capital expenditure pullback, the data suggest the US economy is entering a more vulnerable phase. While not yet contractionary in the aggregate, the rapid slowing underscores rising risks and a fading buffer against external shocks. With all three Business Conditions Monthly indicators registering meaningful declines, the March data present the clearest signal yet that the post-pandemic expansion is encountering genuine fatigue, and that downside risks are no longer hypothetical but visible across multiple timeframes.
DISCUSSION
April’s inflation data reveal a nuanced and still-developing picture of how tariff policy is shaping US consumer prices. Headline and core CPI both rose modestly, with monthly gains of 0.2 percent and 0.24 percent, respectively, but the composition of that inflation was notable. Core goods prices, particularly in tariff-exposed categories like furniture, electronics, and appliances, rose after months of deflation—indicating early signs of tariff pass-through. Yet broad-based disinflation in travel services, like airfare and hotel lodging, counterbalanced those gains, with nearly 40 percent of core categories posting price declines. Core services inflation did tick up, driven by medical services and rent, though much of it remains in line with pre-pandemic norms. Despite the small upside surprises, markets remained unconvinced that the Federal Reserve will act swiftly, with rate cut expectations only modestly affected. Analysts generally see the Fed holding firm until clearer evidence of persistent inflation emerges, particularly as future tariff rounds may yet push prices higher.
Producer price data, however, told a somewhat different story, as wholesale prices unexpectedly declined by 0.5 percent in April—the steepest drop in five years—suggesting many firms are still absorbing cost increases rather than passing them on. Core producer inflation, stripping out food and energy, also fell 0.4 percent, with margins narrowing across several wholesale sectors including machinery and auto distribution. This implies that while consumer-facing prices are firming in select goods categories, much of the pricing pressure is being contained at the corporate level. Companies are responding unevenly: some automakers are holding or cutting prices to maintain demand, while others, like Walmart, warn of upcoming hikes. The ability to pass on costs remains constrained, as shown by surveys indicating fewer than 20 percent of firms can fully offset a 10 percent increase in input costs. With consumer sentiment weak and retail sales barely rising, firms are balancing pricing power against demand fragility. Together, the CPI and PPI data suggest early signs of tariff pass-through are emerging but remain partial and uneven—limited for now by corporate margin compression and service-sector deflation. Whether these pressures accumulate into broader consumer inflation in the months ahead remains an open question the Fed is watching closely.
The Federal Reserve’s preferred inflation metric, the personal consumption expenditures (PCE) price index, was flat in April, marking the first time in nearly a year that monthly price growth completely stalled. Core PCE — which excludes food and energy and is more closely watched by policymakers — was also unchanged, the weakest print in almost five years. While this suggests inflation may be cooling in aggregate, the data follows a first quarter in which core PCE still rose at an annualized 3.5 percent rate, its fastest pace in a year. The figures reflect a pre-tariff snapshot of the economy, which was already decelerating due to a surge in imports and softer consumption. As such, the April stagnation in PCE likely represents a temporary reprieve. Economists warn that the cumulative impact of President Trump’s sweeping tariffs, many of which are just beginning to filter through supply chains, may reignite inflationary pressures while also weighing on demand. This scenario could complicate the Fed’s dual mandate, forcing a tradeoff between stabilizing prices and sustaining employment — a dilemma that suggests interest rates will remain on hold until more data comes in.
Indeed, a wide range of regional and sectoral price metrics are flashing signs of renewed inflationary pressure. The ISM manufacturing and services prices indexes surged in April to 69.8 and 65.1, respectively — the highest levels in well over a year. Data from S&P Global confirmed that both goods producers and service firms raised output prices at the fastest pace since early 2023. Multiple regional Federal Reserve banks also reported widespread price increases: the Kansas City Fed’s manufacturing “prices received” index nearly doubled, while the Dallas Fed and Philadelphia Fed showed similar momentum in both manufacturing and services. Although a few pockets — such as New York and Philadelphia services — saw slight easing, the vast majority of indicators point to intensifying pricing behavior across the economy. These gains may not yet be fully captured in headline inflation figures like PCE or CPI but suggest upstream cost pressures are building. If these regional and sectoral trends persist, they are likely to show up more clearly in broader inflation data in the coming months, reinforcing the Fed’s current reluctance to lower interest rates and heightening the risk of a more entrenched inflation regime.
Those rising price pressures and broadening business uncertainty tied to evolving US trade policy are additionally being captured in manufacturing and services surveys. The ISM Manufacturing PMI slipped to 48.7, deepening a current contraction trend, but the underlying dynamics are more telling: supplier deliveries slowed, input costs accelerated, and export orders dropped sharply amid tariff-related disruptions. Manufacturers reported elevated logistics complexity and an urgent need to rebuild inventories, while facing difficulty passing on rising costs to end users in a cooling demand environment. On the services side, activity expanded more than expected, with the ISM index rising to 51.6, but the prices-paid component surged to 65.1 — the highest since 2022 — reflecting widespread cost increases across sectors like health care and utilities. Survey respondents noted a mix of pre-tariff buying (especially in autos), efforts to shift sourcing domestically, and concern that smaller firms may not remain competitive under the new cost structures. Employment trends remained weak in both sectors, with continued hiring freezes tied to financial uncertainty. Taken together, the data suggest inflationary momentum may be building in specific supply chains even as aggregate demand softens — a dynamic that could complicate monetary policy in the months ahead.
The US Bureau of Labor Statistics data release covering April 2025 came in stronger than expected, with payrolls rising by 177,000, the unemployment rate steady at 4.2 percent, and labor force participation ticking up to 62.6 percent. Gains were concentrated in education, health services, and trade and transportation, bolstered by temperate weather and lingering effects from stimulus programs. The observed strength, however, likely represents the final pre-shock snapshot before the economic impact of President Trump’s “Liberation Day” tariffs begin to impact labor markets.
Early signs of damage are already emerging, with manufacturing and retail trade both shedding jobs, and average hourly earnings growing only 0.2 percent: a sign that wage growth is stalling. Importantly. The timing of the April report excluded the sharp post-tariff decline in freight traffic and tourism activity, which are likely to weigh heavily on May and June data, particularly in leisure, hospitality, and construction. As tariffs raise uncertainty and operating costs, employers are likely to slow hiring and potentially freeze wages in the most exposed sectors. Despite strong headline figures, financial markets are treating April’s data as backward-looking and await clearer signals on the full employment impact of ongoing trade disruptions.
Consumer and business sentiment across the US is deteriorating. The University of Michigan’s consumer sentiment index fell in early May to 50.8, just above its all-time low, as nearly three-quarters of respondents spontaneously cited tariffs, reflecting anxiety that crosses political lines. Inflation expectations surged, with consumers now anticipating 7.3 percent price growth over the next year—the highest since 1981—even though actual price data have not borne out such dramatic increases. Meanwhile, the National Federation of Independent Business reported a fourth consecutive monthly decline in small business optimism, driven by sharply falling expectations for sales and business conditions. The share of owners planning capital investment and raising compensation plummeted to multi-year lows, highlighting growing reticence to invest in expansion. Though labor demand remains relatively strong, confidence among entrepreneurs is sliding at the fastest pace since the Covid pandemic, signaling that uncertainty around tariffs and tax policy is weighing heavily on forward planning. Both consumers and businesses appear to be reacting more to perceived instability than to realized economic deterioration—yet if confidence continues to erode, that perception could become a self-fulfilling drag on growth.
US retail sales growth slowed sharply in April, reinforcing the broader narrative of waning consumer confidence and growing caution amid trade uncertainty. The 0.1 percent monthly gain in headline sales, a dramatic pullback from March’s 1.7 percent surge, was driven by declines in car sales, sporting goods, apparel, and other tariff-exposed categories—suggesting consumers may have front-loaded purchases in anticipation of price hikes before stepping back. Notably, “control group” sales, which feed directly into GDP estimates, fell 0.2 percent, raising concerns about a weak start to second-quarter growth. These figures come alongside a historic drop in consumer sentiment, with inflation expectations at multi-decade highs and confidence in future financial conditions near record lows, amplifying the risk that even temporary trade relief won’t reverse deteriorating sentiment. Small businesses are echoing this concern, with falling sales expectations and dimmed capital spending plans, despite stable labor market conditions. Executive commentary from firms like Walmart, Energizer, and Nu Skin underscores a shared anxiety about tariff-driven inflation and its drag on demand, even if actual price pass-through remains modest for now.
Productivity data from the first quarter of the year painted a soft picture, with nonfarm business labor productivity declining at an annualized rate of 0.8 percent (largely the result of output contracting 0.3 percent while hours worked rose 0.6 percent). Hourly compensation, meanwhile, increased by 4.8 percent, pushing unit labor costs up by 5.7 percent, a sharp acceleration from the previous quarter. The divergence between wage growth and productivity suggests rising cost pressures for firms, which may translate into inflation if businesses pass those costs on to consumers rather than absorbing them. (Of note, however, is that quarterly productivity figures are often volatile and subject to later revision; for that reason, Federal Reserve policymakers are likely to treat this particular data point cautiously.)
Much of the weak output is believed to stem from temporary distortions in trade flows related to unpredictable and rapidly shifting tariff policies rather than signaling a structural slowdown in business activity at this point. Indeed, the Fed has characterized recent economic conditions as “solid” and attributed the disappointing first-quarter GDP figures to transitory movements in net exports. Nonetheless, the data underscore an important tension that may build in importance over the coming months: if wages continue to rise faster than productivity for a sustained period, inflationary risks could build—even in an otherwise stable economic backdrop.
At the May 6-7 FOMC meeting, the Federal Reserve held interest rates steady at 4.25 to 4.5 percent, citing rising uncertainty about the economic outlook and the dual risks of elevated inflation and growing unemployment. Chair Jerome Powell emphasized the Fed’s readiness for multiple scenarios but refrained from committing to any near-term rate cuts, signaling a more reactive stance in the face of unpredictable trade and fiscal policy. As often occurs owing to the existence of the dual mandate, the Fed faces a dilemma: the inflationary effects of tariffs may require tighter policy just as economic activity and employment are at risk of contracting and weakening, respectively. Many analysts now expect the Fed to wait until late in the third quarter before easing, seeking additional clarity on how tariffs impact prices, supply chains, and business investment. Although recent labor data has been resilient, it has not yet captured the lagged effects of trade disruptions. The cautious tone has shifted the burden of clarity onto the administration, with July’s tariff pause deadline and forthcoming inflation data likely to shape the Fed’s next move. While market expectations lean toward a July cut, the US central bank appears more likely to delay until conditions clearly deteriorate—potentially setting the stage for sharper, more decisive action later.
US Treasury bond markets have been signaling alarm regarding widening US fiscal imbalances, and the Moody’s downgrade of America’s credit rating reflected that anxiety. The ratings agency cited a persistent surge in debt and deficits—now approaching 100 percent of GDP—and warned that absent meaningful reforms the rising cost of borrowing would undermine fiscal sustainability. Investors pushed 30-year Treasury yields above 5 percent, with shorter-term securities also yielding over 4 percent, reflecting a clear and growing premium to hold US debt amid mounting uncertainty. The scale of the challenge is striking: US public debt has ballooned from $10 trillion in 2007 to over $36 trillion today, with interest payments projected to run between $1T and $1.2T in 2025. US Treasury Secretary Scott Bessent has acknowledged that the current path is unsustainable, yet the administration continues to rely on short-term borrowing, increasing rollover risk in future debt-ceiling showdowns. Markets may now, as they have in the past, ultimately force fiscal discipline—especially if long-term rates stay elevated. While the US still benefits from deep capital markets and strong demand for short-term bills, rising interest costs and political gridlock are quickly eroding the fiscal flexibility that once underpinned, and indeed underwrote, American economic dominance.
Over more than four decades, the dominant driver of worsening US fiscal sustainability has not been entitlement growth or tax cuts, but economic shocks—especially recessions and financial crises. The federal debt-to-GDP ratio has quadrupled since 1980, rising from 25 percent to nearly 100 percent, with more than half of that increase attributable to the 2008 financial crisis and the COVID-19 pandemic alone. While spending on Social Security and Medicare has grown steadily, it has largely followed or even fallen below Congressional Budget Office projections. The 2017 Tax Cuts and Jobs Act contributed modestly—adding at most 6 percentage points to the debt ratio—while the Biden administration’s stimulus, infrastructure, and climate bills, along with student-loan forgiveness efforts, are now contributing to rising deficits through surging interest payments. Notably, the Department of Government Efficiency (DOGE), led by Elon Musk, has achieved $160 billion in estimated annual savings, mostly by cutting grants and programs in USAID and HHS, though these reductions are only loosely correlated with actual budgetary weight. The clear takeaway is that recessions—not baseline spending—are the main accelerants of debt accumulation. With recession risks rising again, the administration’s top priority for preserving fiscal health must be to avoid triggering another major downturn.
The US economy is facing a confluence of overlapping risks: trade-related uncertainty, fragile inflation dynamics, and tightening fiscal constraints amid political acrimony. While headline inflation remains moderate, tariff-sensitive goods categories are beginning to show early signs of price pass-through, even as services like travel and lodging continue to exert disinflationary pressure. Producer price data suggest many businesses are still absorbing higher input costs, but this margin compression is not sustainable indefinitely, especially with labor productivity falling and unit labor costs rising over 5 percent. Consumer and business sentiment has slumped in ways rarely seen outside of recessions, with inflation expectations surging and confidence in future economic conditions approaching crisis-era lows. Retail sales growth has slowed sharply, hinting that recent consumption strength may be fading just as the impact of tariffs on freight, hiring, and prices begins to intensify.
The Federal Reserve faces a policy dilemma: raising rates risks undercutting an already-fragile recovery, while cutting prematurely could stoke inflation if tariffs and wage gains continue to push prices higher. Complicating matters further, America’s ballooning debt load and growing reliance on short-term financing have triggered a bond market backlash and a Moody’s downgrade, all while fiscal space to respond to a downturn is rapidly evaporating. Taken together, these conditions suggest the economy has entered a critical inflection point, with policymakers walking a narrowing tightrope between managing inflation, supporting growth, and preserving long-term fiscal credibility all in as uncertain an environment as has been seen in many decades. Heading into the second half of 2025 growth risks are skewed to the downside. Strong caution is warranted.