

As we mark five years since the onset of the COVID-19 pandemic, many headlines trumpet the resilience of the US economy: unemployment is low, GDP has returned to growth, and markets have rebounded. But beneath the surface-level indicators lies a more complicated and sobering picture.
A close examination of key economic metrics reveals that in several important areas, the US economy has not fully recovered from the effects of both the virus and the extraordinary government interventions it prompted. Despite warnings from economists and policy experts in 2020, the country implemented sweeping lockdowns, business closures, and monetary and fiscal expansions at a scale never seen before. These efforts were often framed as a necessary tradeoff between public health and economic output — a false dichotomy that ignored the long-run consequence of suppressing economic activity at such a vast scale.
Today, the costs of those tradeoffs are still being paid, and the full price may not be known for years to come.
(All images sourced from Bloomberg Finance, LP)
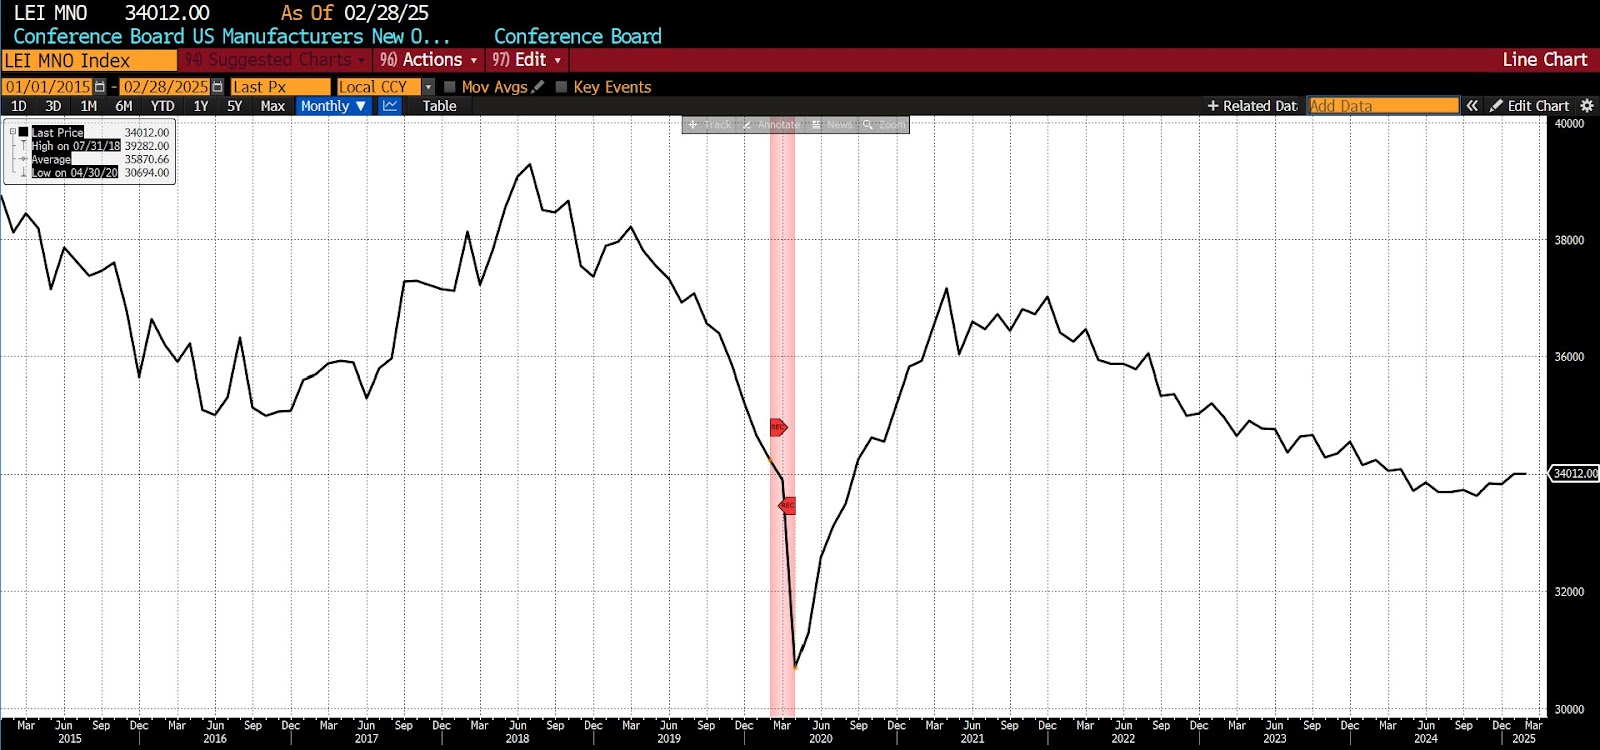
1. US Manufacturers New Orders for Nondefense Capital Goods Excluding Aircraft (Conference Board)
One key indicator is the Conference Board’s New Orders for Nondefense Capital Goods Excluding Aircraft, which serves as a proxy for business investment in equipment and durable inputs. From 2015 through early 2020, the metric showed steady growth, signaling strong confidence and ongoing capital formation. But in the wake of pandemic disruptions, new orders plummeted. Although recovery began in 2021 and was supported by historically low interest rates, the metric remains below its pre-pandemic trajectory. As of March 2025, a slight month-over-month decline (-0.1 percent ) suggests that firms remain cautious about long-term investment. The uneven rebound signals lingering uncertainty in the business environment and may point to structural concerns like reshoring, labor shortages, or geopolitical risk.
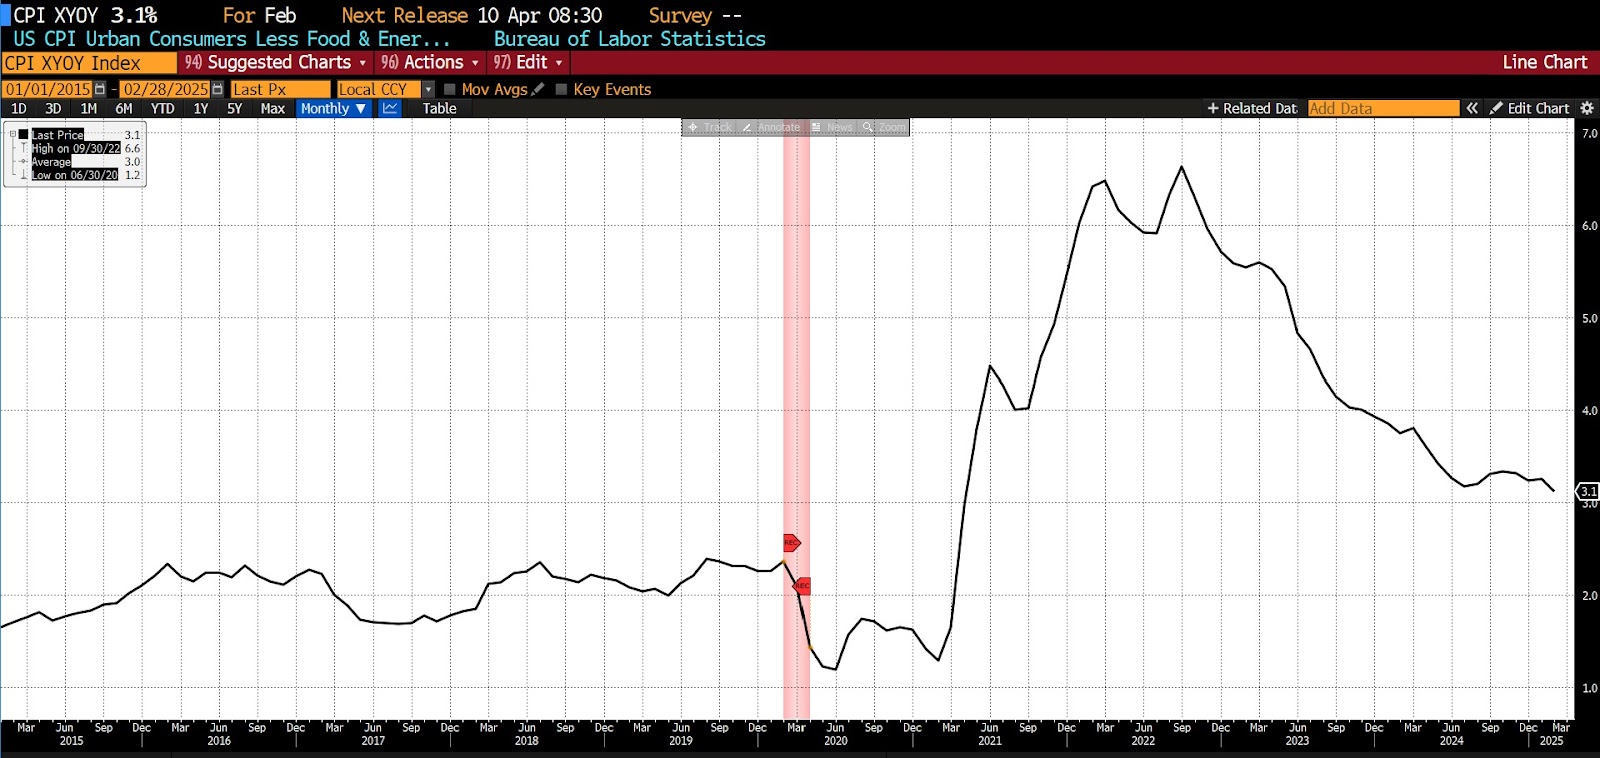
2. US CPI Ex Food & Energy, Year-Over-Year (US Bureau of Labor Statistics)
Core CPI, which strips out volatile food and energy prices to provide a clearer picture of underlying inflation, remained stable at around 2 percent from 2015 to early 2020. But pandemic-era policies — including trillions in federal stimulus and prolonged supply chain disruptions — led to a surge in price growth. Core inflation peaked in 2022 and has cooled since, but as of early 2025, it remains elevated at roughly 3.1 percent year-over-year. This persistent inflation has eroded consumer purchasing power, particularly for middle- and lower-income households. It also complicates the Federal Reserve’s ability to ease monetary policy, potentially dampening future growth.
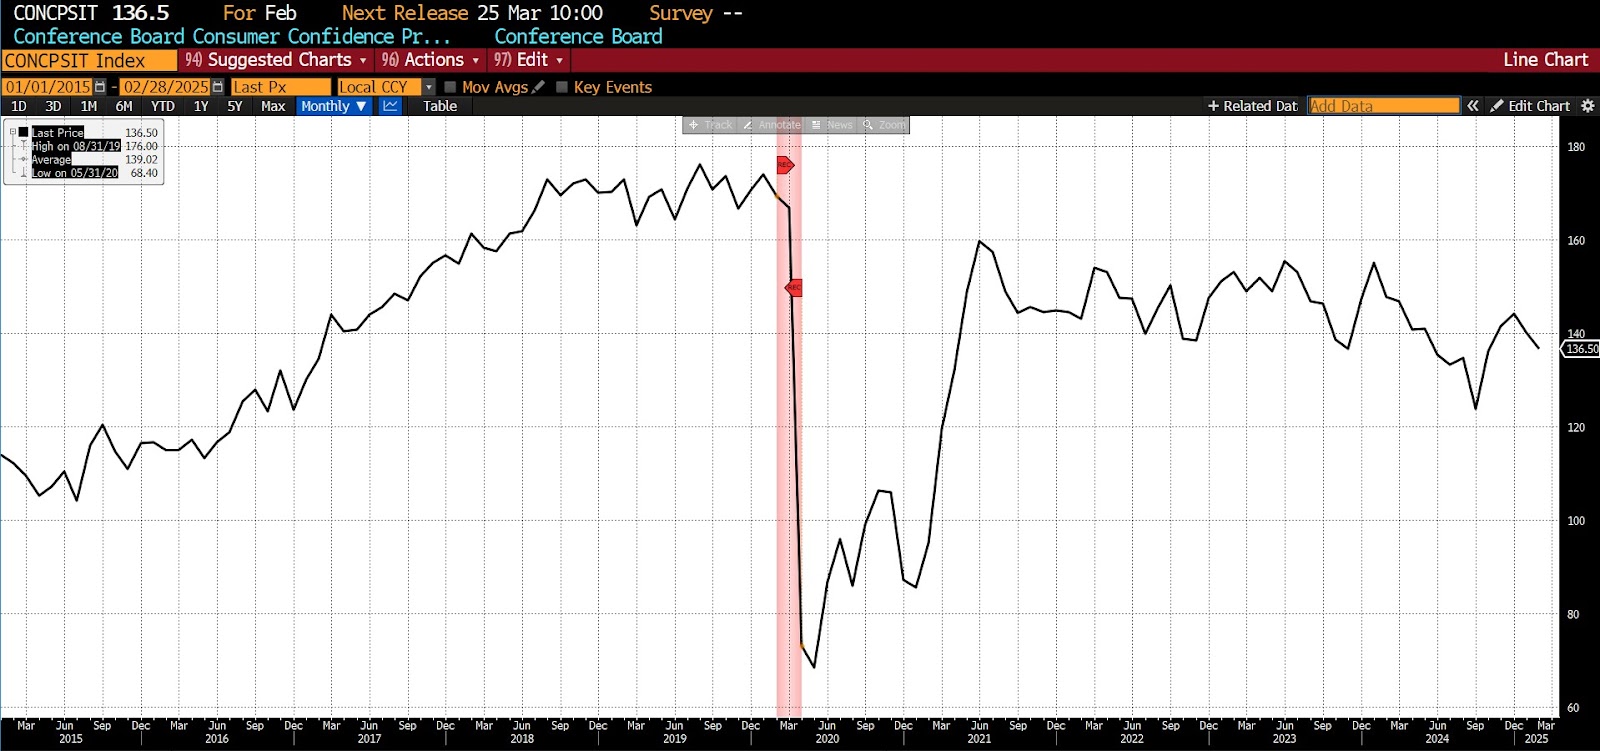
3. Conference Board Consumer Consumer Confidence Present Situation (Conference Board)
Consumer confidence, as measured by the Conference Board’s Present Situation Index, offers insight into how Americans perceive current economic conditions. Between 2015 and early 2020, consumer sentiment was buoyant, driven by low unemployment and strong income growth. The pandemic caused a steep drop, and while confidence has partially rebounded, it has not returned to prior highs. In 2025, many households remain wary amid ongoing concerns over inflation, interest rates, and job security. This hesitancy is reflected in cautious spending patterns and a reluctance to take on new debt, both of which could suppress future economic dynamism.
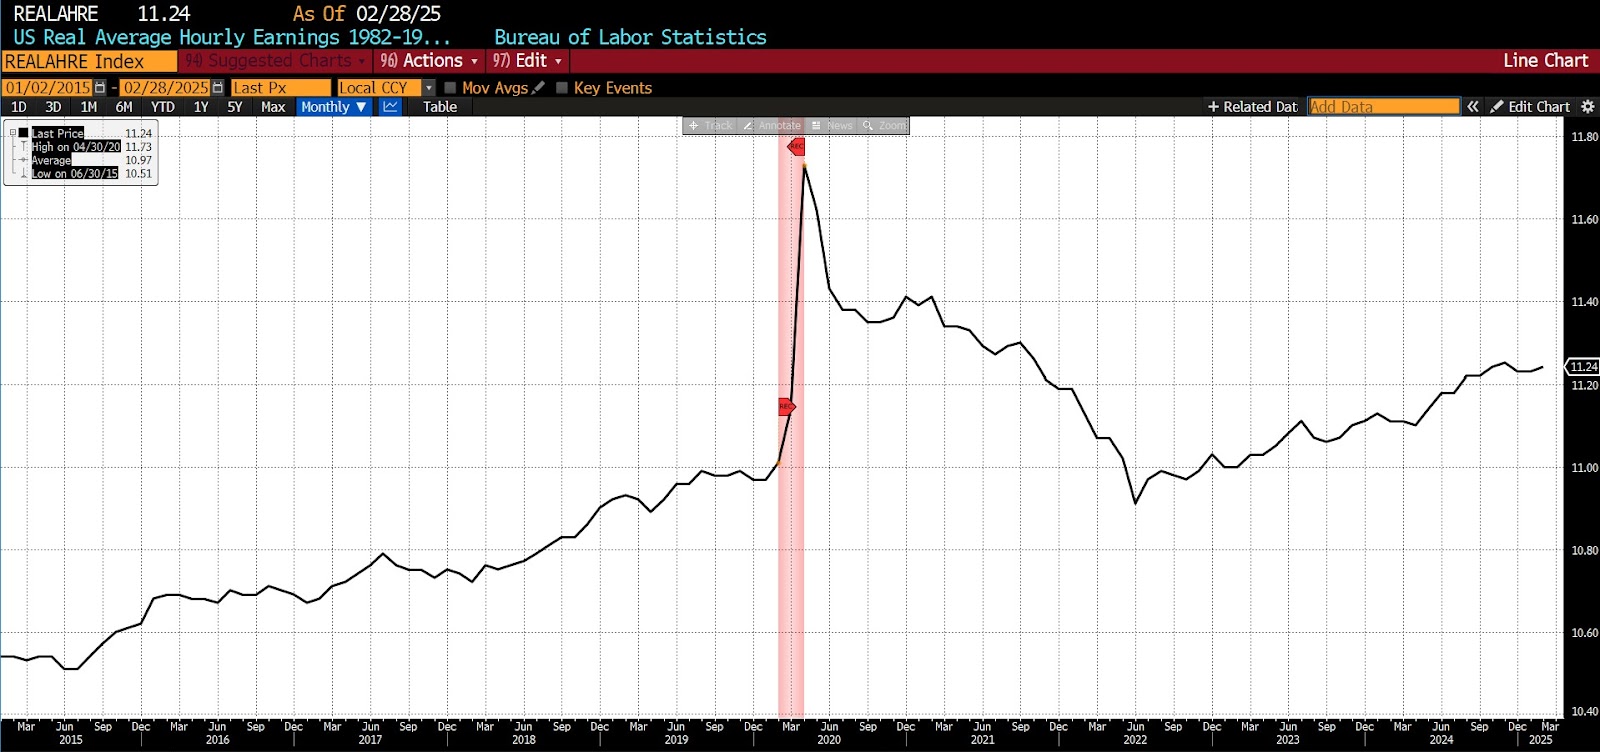
4. Real Average Hourly Earnings (1982–1984 Dollars, Seasonally Adjusted) (US Bureau of Labor Statistics)
Real average hourly earnings (adjusted to 1982-1984 dollars) present a mixed picture. From 2015 to 2020, real wages rose modestly in line with productivity gains and low inflation. In 2020, as lower-wage workers were disproportionately affected by job losses, average real wages appeared to increase temporarily. But subsequent inflation wiped out those gains. By 2025, real wages have only slightly improved relative to pre-pandemic levels, indicating that nominal wage increases have not kept pace with the cost of living. This stagnation undermines household financial resilience and places greater pressure on public support programs.
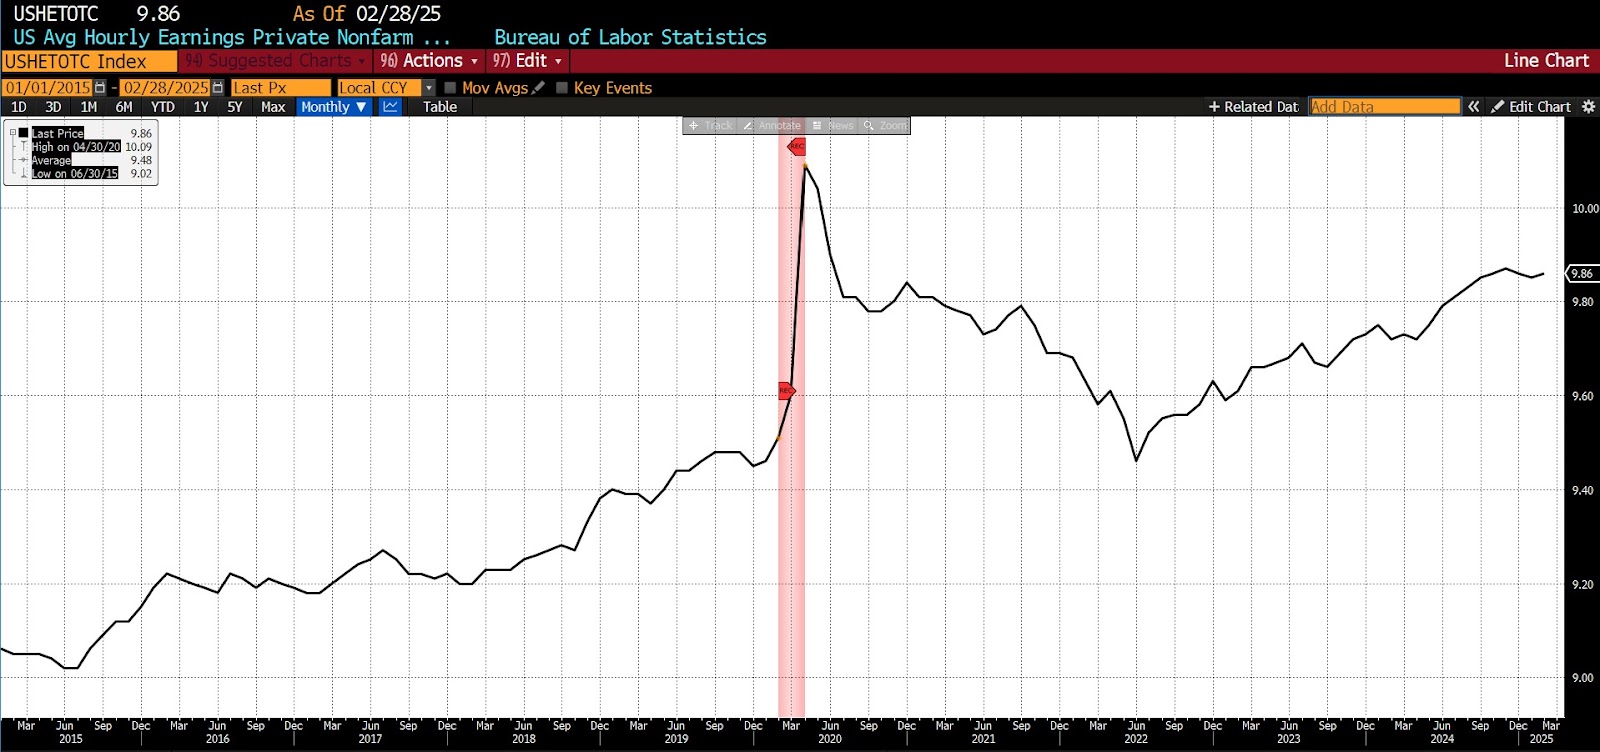
5. US Average Hourly Earnings Private Nonfarm Payrolls (1982 Dollars) (US Bureau of Labor Statistics)
Similarly, real average hourly earnings in the private nonfarm sector have struggled to regain momentum. Prior to 2020, steady gains reflected a competitive labor market and healthy economic fundamentals. Post-pandemic, however, wage growth has been neutralized by rising prices, leaving many workers with stagnant or declining real incomes. While some sectors — such as tech and logistics — have fared better, much of the workforce remains in a holding pattern. This weak earnings recovery affects not just consumption but also savings, investment, and overall quality of life.
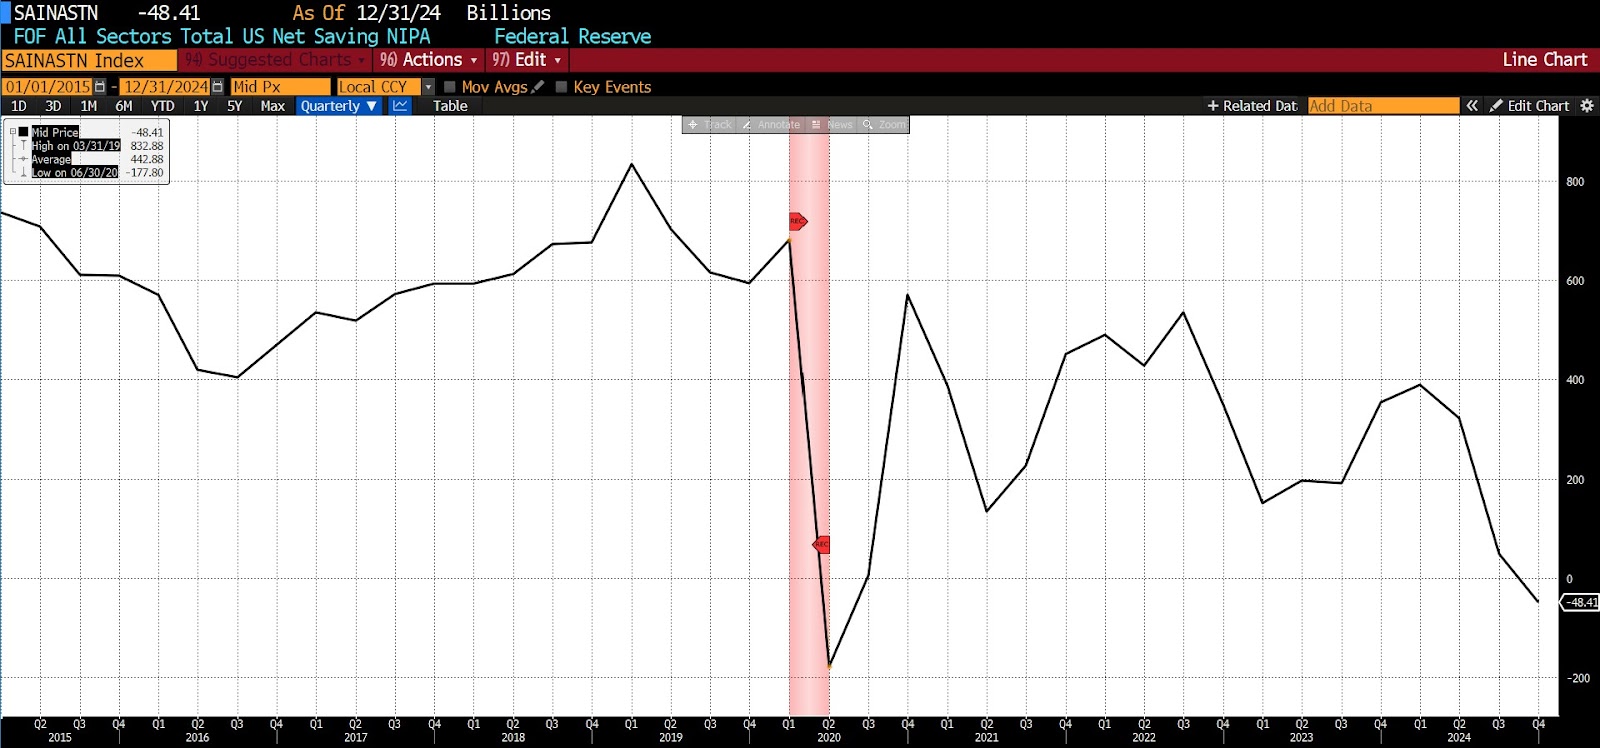
6. Total Net US Saving, All Sectors (Flow of Funds, NIPA) (US Bureau of Economic Analysis)
Net saving across all sectors, as measured by the Flow of Funds accounts, showed balance in the years leading up to the pandemic. In 2020, government transfers and reduced consumption pushed household savings to record highs. But that was a temporary artifact. As of 2025, net saving has returned to trend or even fallen below it, as households grapple with higher living costs and diminished purchasing power. This reversal undermines long-term capital accumulation and leaves families more exposed to economic shocks.
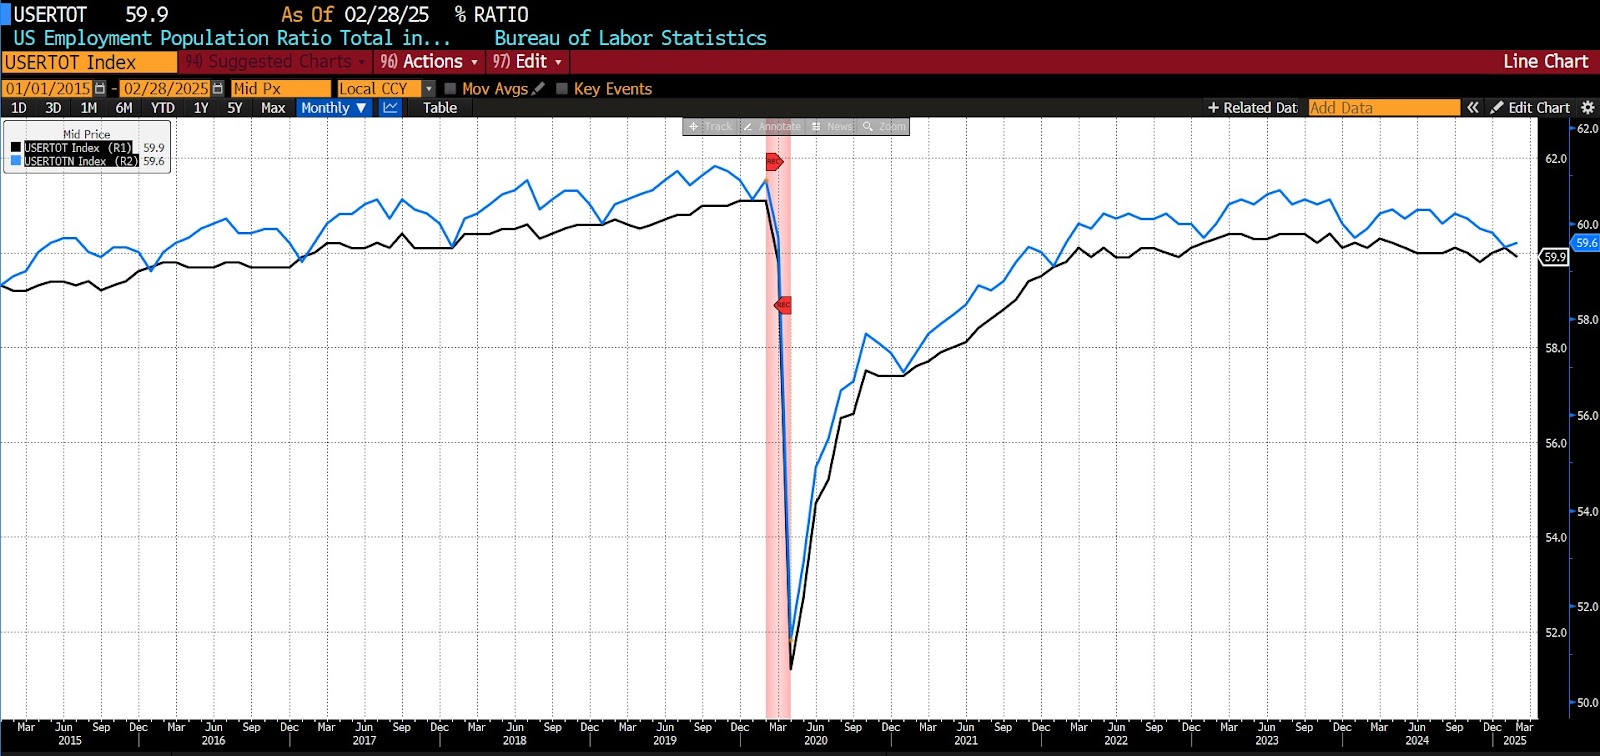
7. US Employment-Population Ratio, Total Labor Force (Seasonally and Not Seasonally Adjusted) (US Bureau of Labor Statistics)
The employment-population ratio offers a broad view of labor market health. From 2015 to 2020, it trended upward, reflecting robust employment gains across most demographics. The ratio collapsed in early 2020 due to mass layoffs and business shutdowns and has not fully recovered even five years later. Persistent shortfalls can be attributed to early retirements, long-term illness, childcare challenges, and shifting labor force preferences. A lower employment-population ratio means fewer workers supporting growing pool of retirees, with implications for productivity, tax revenues, social program solvency, and economic growth as a whole.
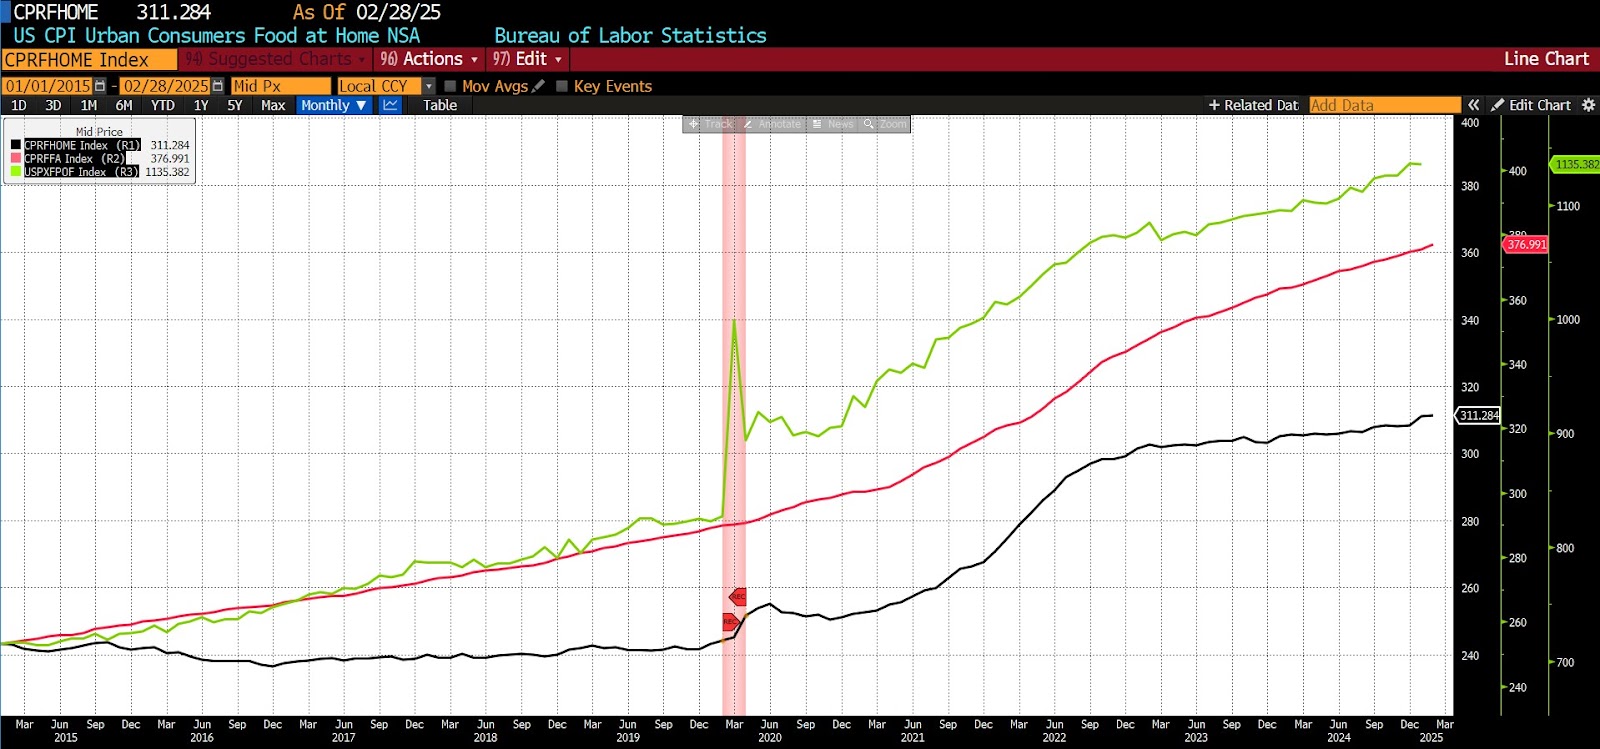
8. Food Price Indexes (Various Measures, US Bureau of Labor Statistics / USDA)
Food prices remained relatively stable for decades, with annual increases closely tracking general inflation. However, the combination of extraordinary fiscal and monetary expansion, global supply chain breakdowns, and labor dislocations during the pandemic triggered a sharp and sustained rise in food costs. Beginning in late 2020 and accelerating through 2022, food prices followed a classic “hockey stick” pattern, with steeper increases in staples such as meat, dairy, and grains. By 2025, although the rate of increase has moderated, prices remain significantly above pre-pandemic levels. For American households — particularly those with fixed or low incomes — this has created lasting pressure on household budgets and elevated food insecurity across communities.
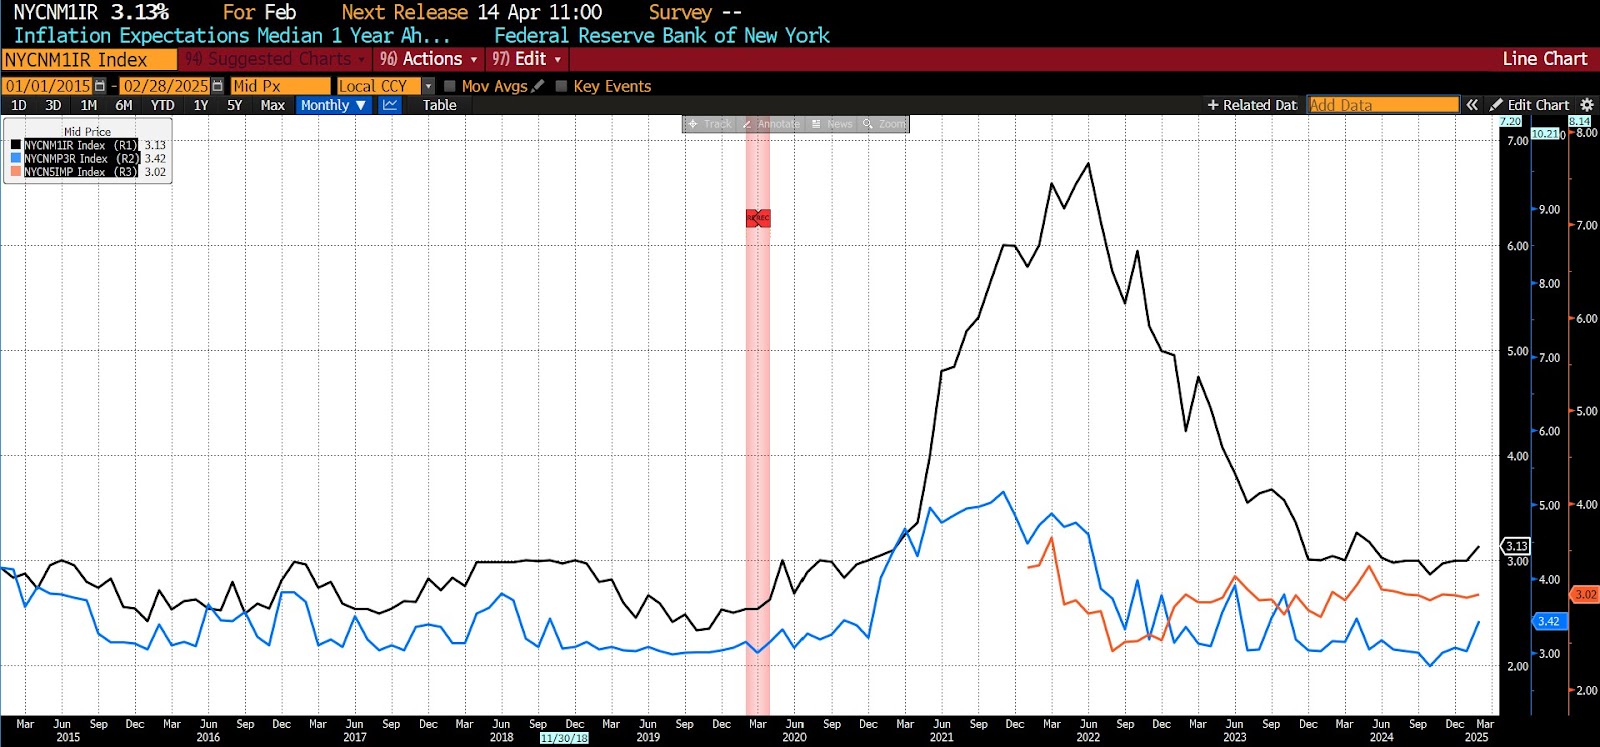
9. Median Inflation Expectations (One-, Three-, and Five-Year Horizons) (Federal Reserve Bank of New York)
Inflation expectations are critical to economic decision-making, influencing wage negotiations, consumer spending, and business investment. Before the pandemic, one-, three-, and five-year inflation expectations were typically stable. Since 2020, however, these expectations have not only risen but become substantially more volatile. This shift reflects the uncertainty introduced by both the initial inflation spike and the policy responses that followed. Elevated and unstable inflation expectations increase the risk premium on investment, discourage long-term contracting, and diminish real wealth as households adjust their behavior to hedge against future price instability. For policymakers, regaining credibility around inflation targeting is now a central challenge.
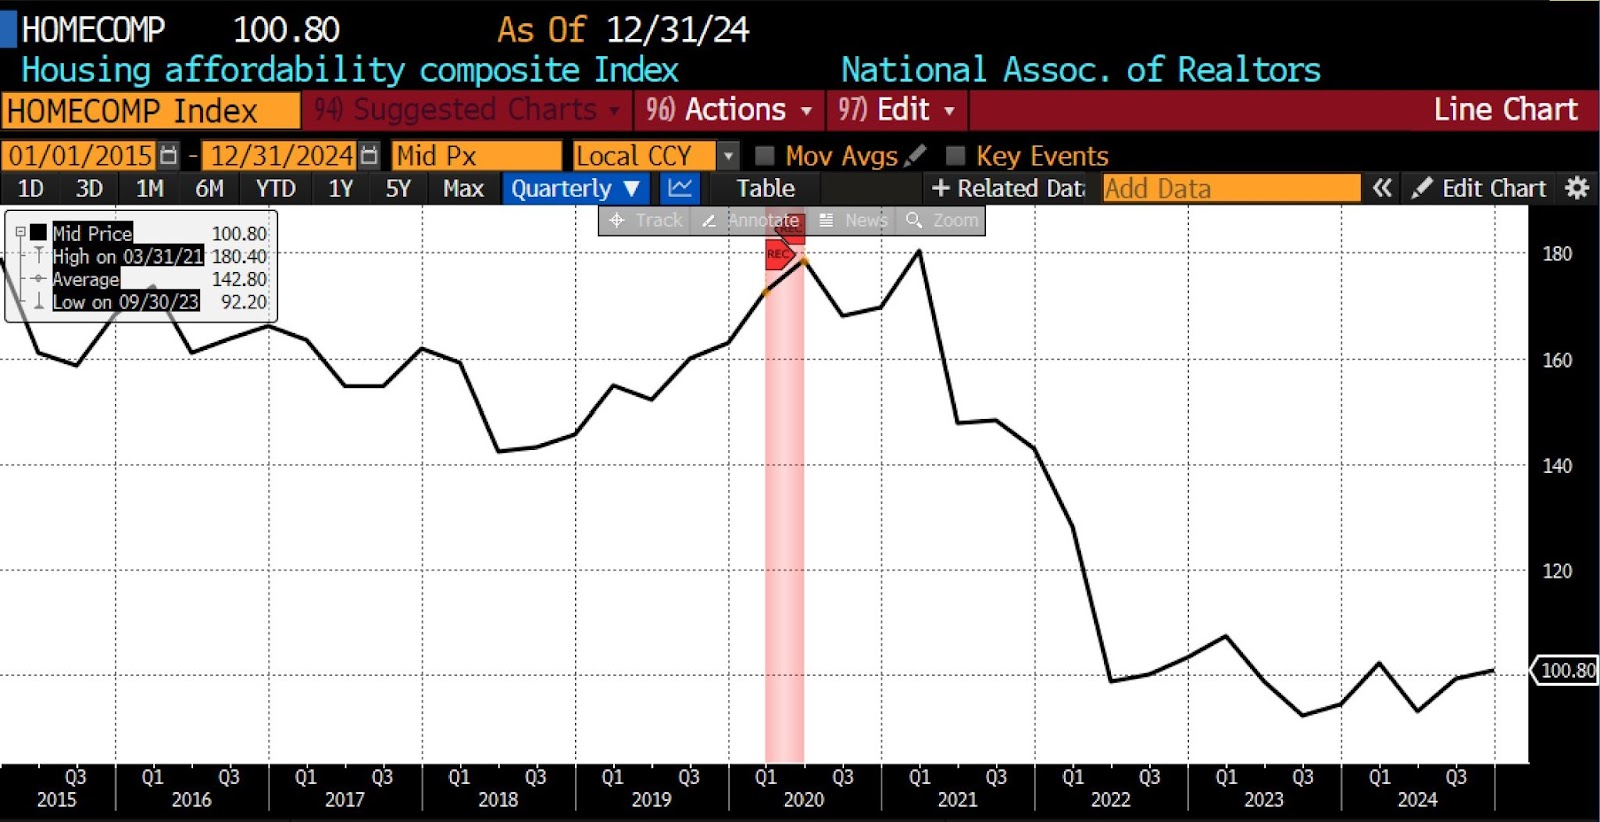
10. Housing Affordability Index, First-Time Buyers (National Association of Realtors)
A combination of factors, including a flight from urban centers facilitated by historically low interest rates and limited inventory drove home prices to unprecedented levels, especially in suburban and rural areas. As a result, first-time buyers — who often lack significant savings — have, since the pandemic, been priced out of the market at historic levels. Massively expansionary Fed policies also drove asset prices, which include home prices, up much faster than wages. Fiscal stimulus programs intended to mitigate economic damage inadvertently fueled demand for housing, intensifying growing price increases. Those dynamics, coupled with ongoing supply chain issues and delays in new housing construction, have deepened the affordability gap to record lows (since 1986), placing homeownership increasingly out of reach of many aspiring buyers.
Taken together, the post-COVID trends in these economic phenomena make clear that while some headline figures paint a rosy picture, the US economy remains structurally altered by the events of 2020. Pandemic-era policies, ostensibly aimed at preserving lives and livelihoods, imposed immense costs on economic activity, some of which were foreseeable and avoidable. By presenting the crisis as a binary choice between public health and economic output, policymakers created a narrative that neglected the possibility of more balanced, targeted interventions. And now, five years later, the economy bears the weight of those decisions. The consequences — lost earnings, reduced investment, lingering inflation, and lower labor force engagement — are still unfolding. As we look ahead, it is crucial to understand that the price of those tradeoffs is not only massive, but still growing and will be paid in ways both visible and hidden for many years to come.